
Comparable Sales Near 7105 Dalegrove Drive, Las Vegas, NV 89129
1st Realty · Comparable sales report · 1st.estate · October 21, 2026
Browse our Las Vegas area guides →
7105 Dalegrove Drive, Las Vegas, NV 89129
Status: Sold
$330,000 Sold Price
$144
$ / Sq Ft
2,296
Living Area
7,841 sqft
Lot Size
4
Beds
3
Baths
1985
Year Built
Search Parameters
Property Type
Status
Radius
Sold Within
Beds
Baths
Living Area (Sq Ft)
Lot Size (Sq Ft)
This comp search reflects your current search parameters — adjust the filters above as needed for a more accurate estimate.
Estimated Value
—
Average $/Sqft
—
Check one or more comps below to calculate an estimate.
Nearest 10 of 18 comparable sales and listings within 1 mile of this home. Use the filters above and press Search to refine.
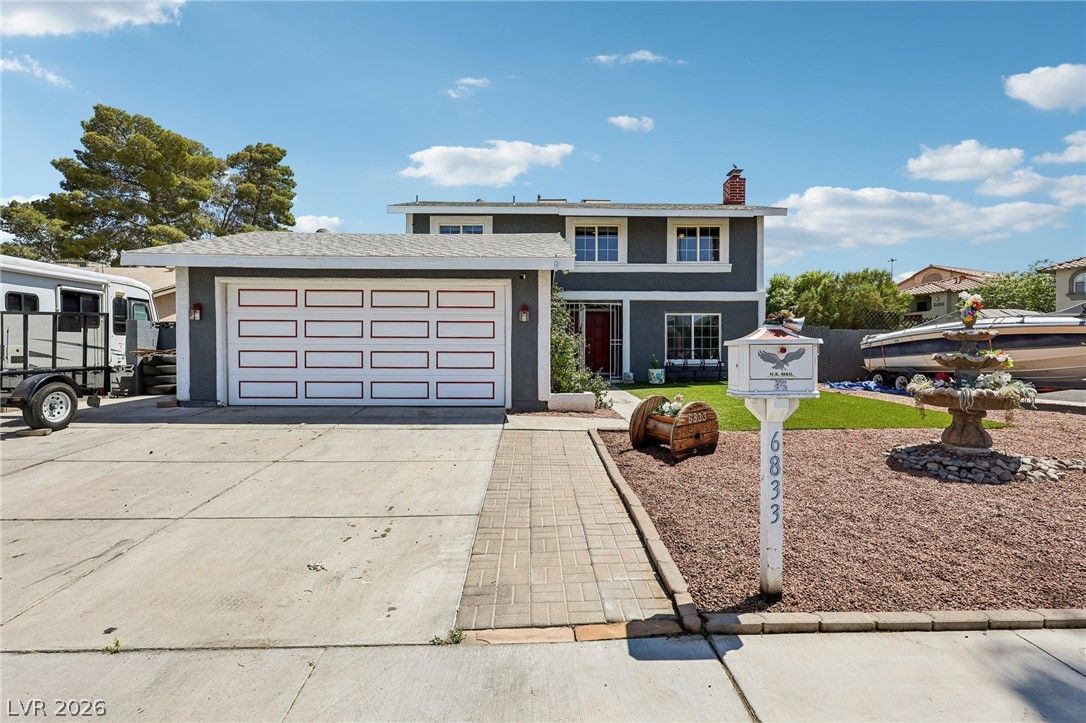
6833 High Bluff WayActive
$460,0004 bd3 ba1,859 sqft$247/sqft0.23 mi1 days
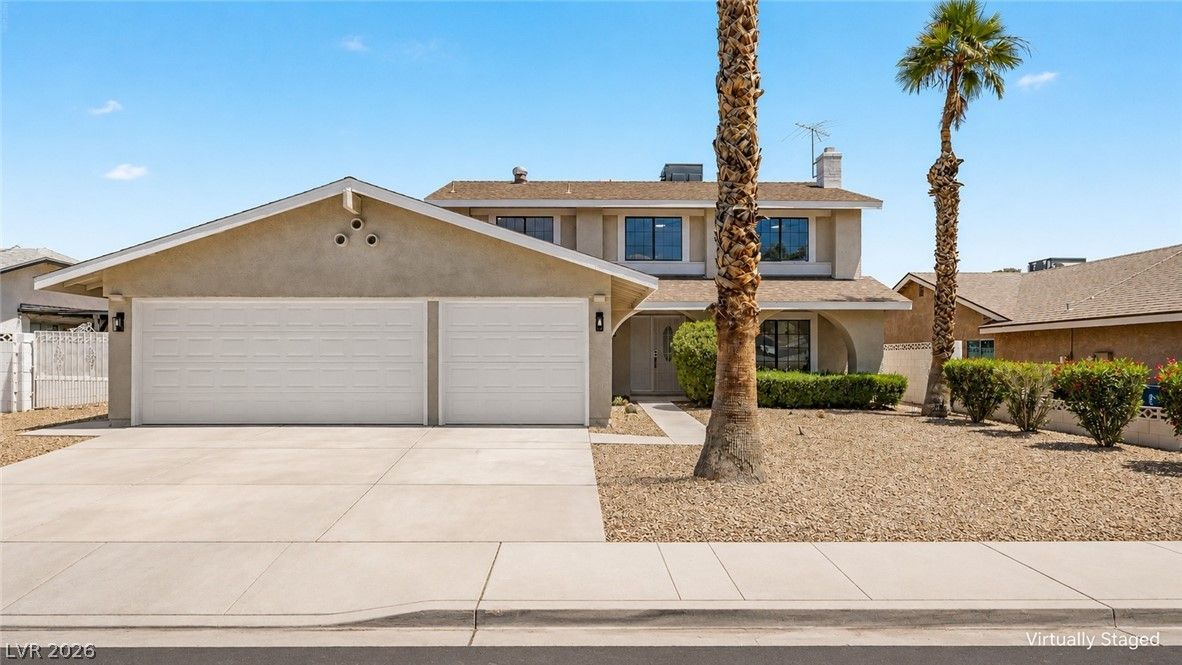
$515,0004 bd3 ba2,249 sqft$229/sqft0.34 mi24 daysSold 2026-07-27
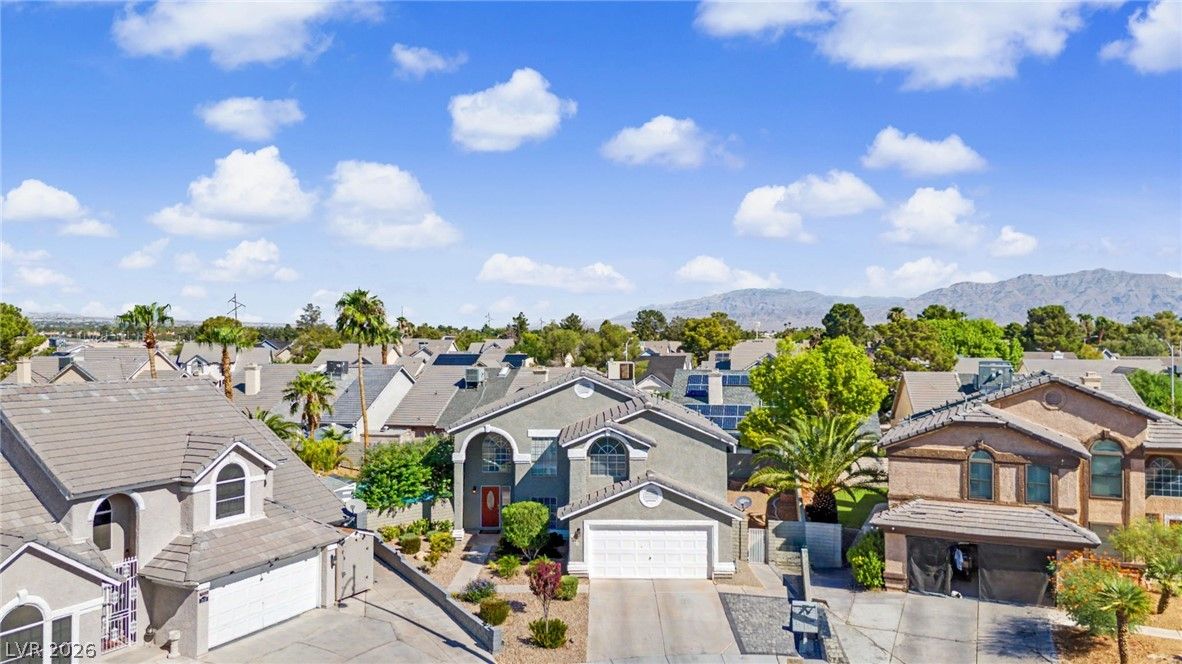
3609 Naugatuck CircleActive
$564,9994 bd3 ba2,181 sqft$259/sqft0.36 mi38 days

$448,0003 bd3 ba2,233 sqft$201/sqft0.41 mi13 daysSold 2026-10-16
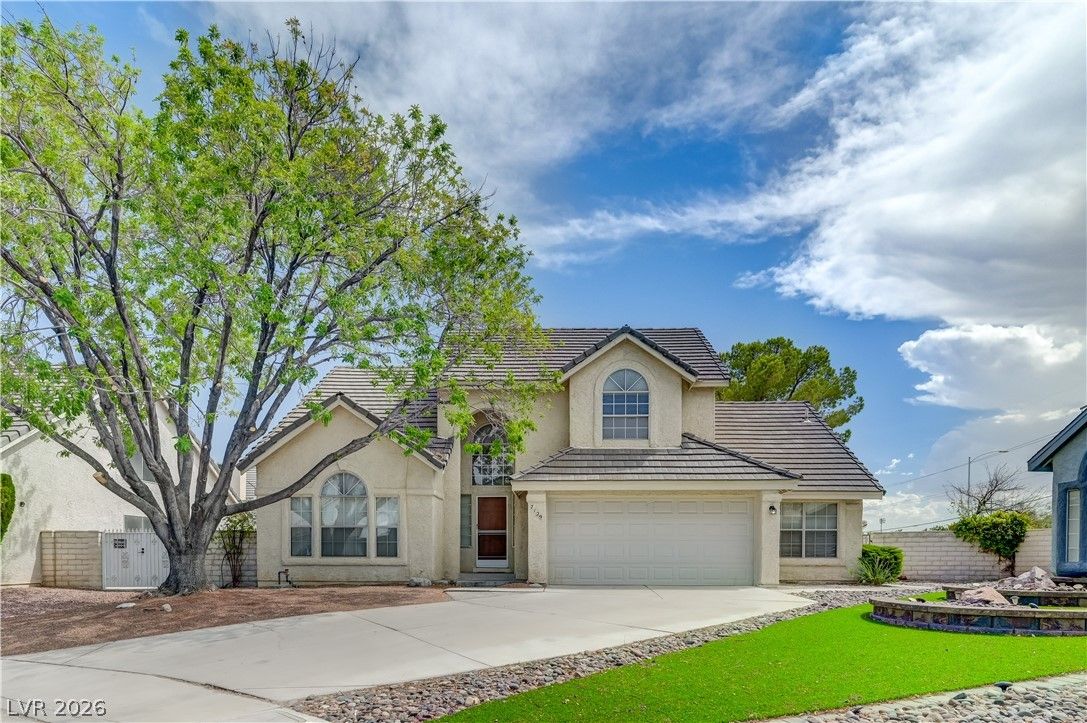
7129 Deepriver CircleActive
$449,9003 bd3 ba2,240 sqft$201/sqft0.43 mi58 days
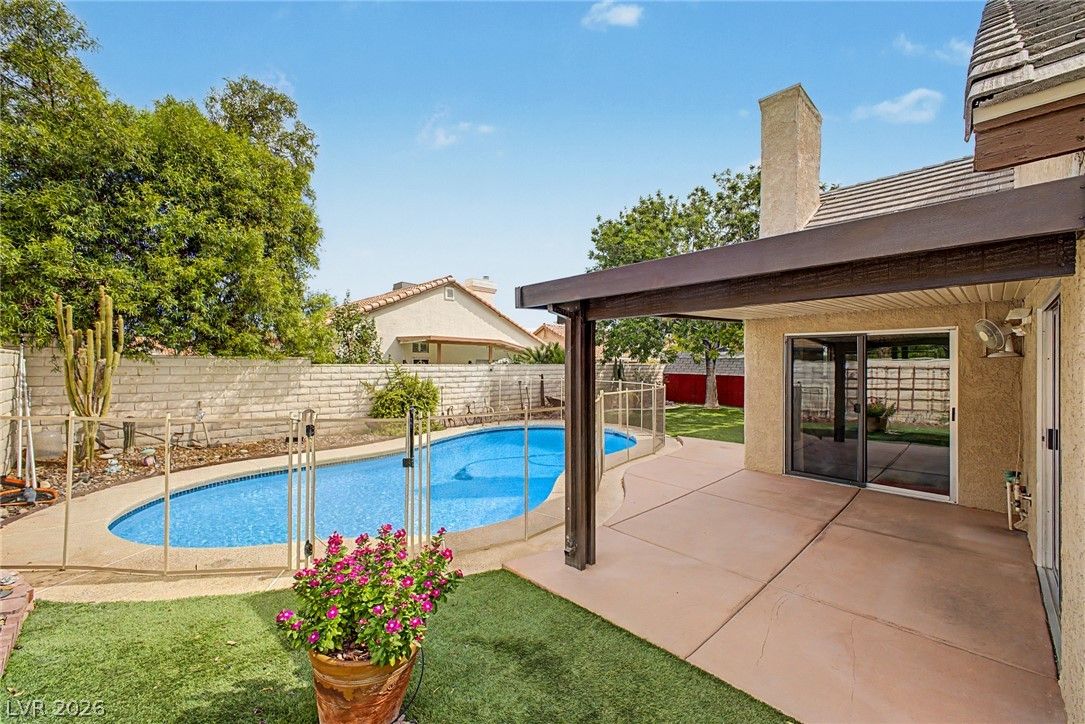
$485,0004 bd3 ba1,990 sqft$244/sqft0.50 mi4 daysSold 2026-09-28
$470,0004 bd2 ba1,888 sqft$249/sqft0.66 mi25 daysSold 2026-04-29
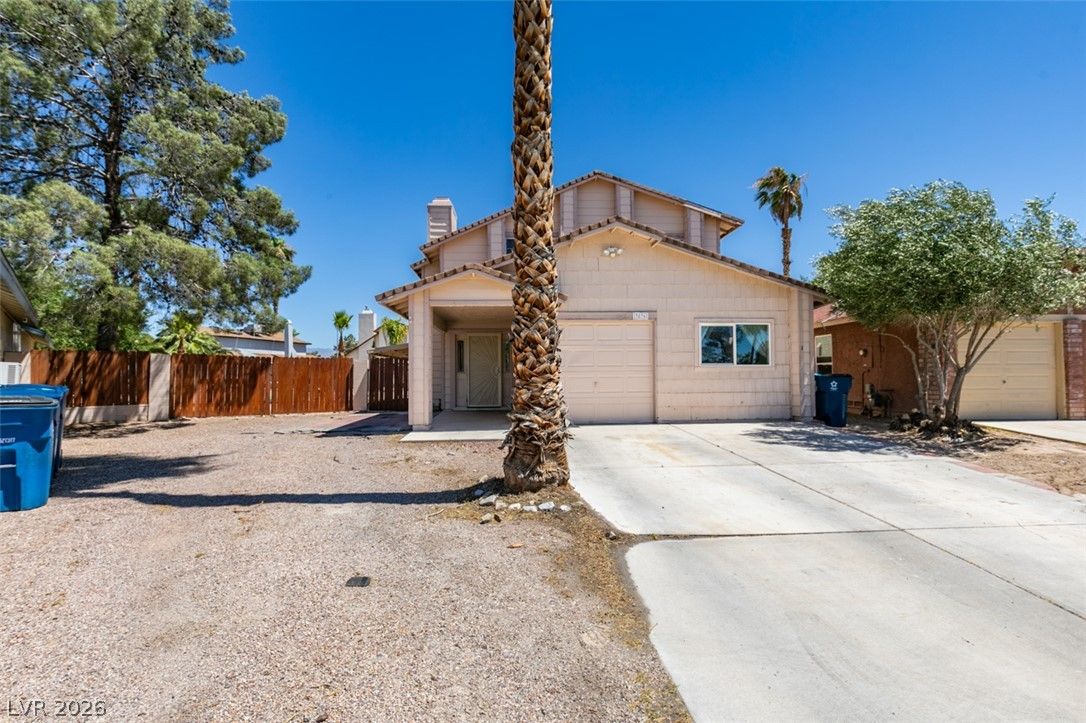
$380,0003 bd2 ba1,737 sqft$219/sqft0.76 mi11 daysSold 2026-09-30
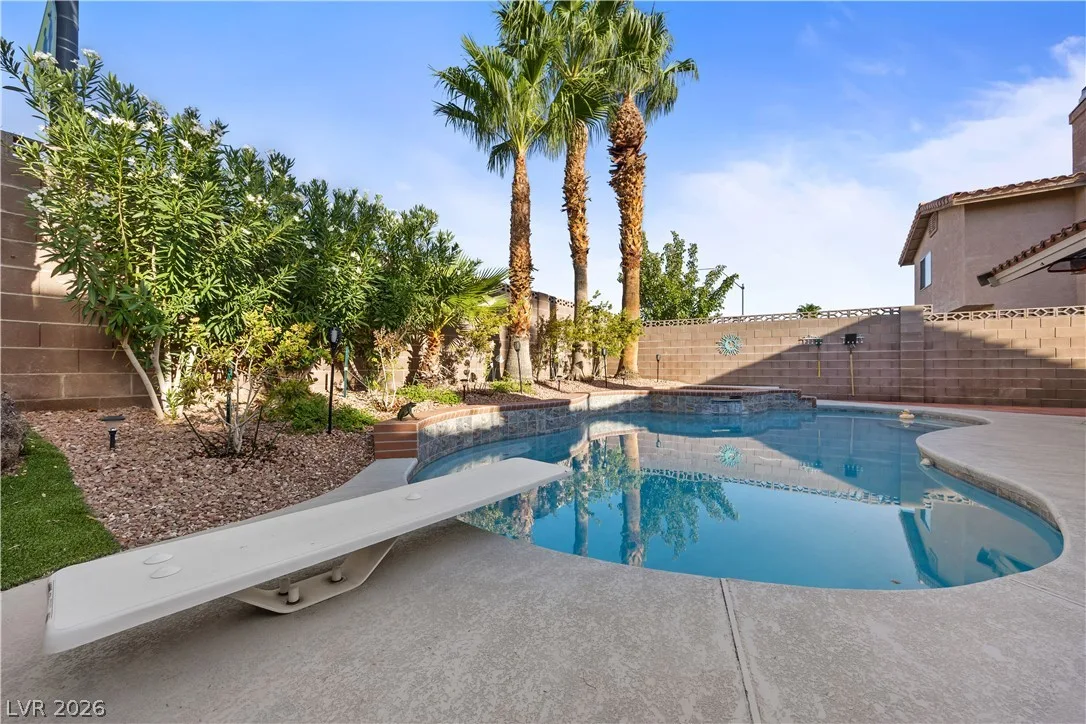
3729 Rockland DriveActive
$520,0003 bd2 ba1,884 sqft$276/sqft0.80 mi1 days
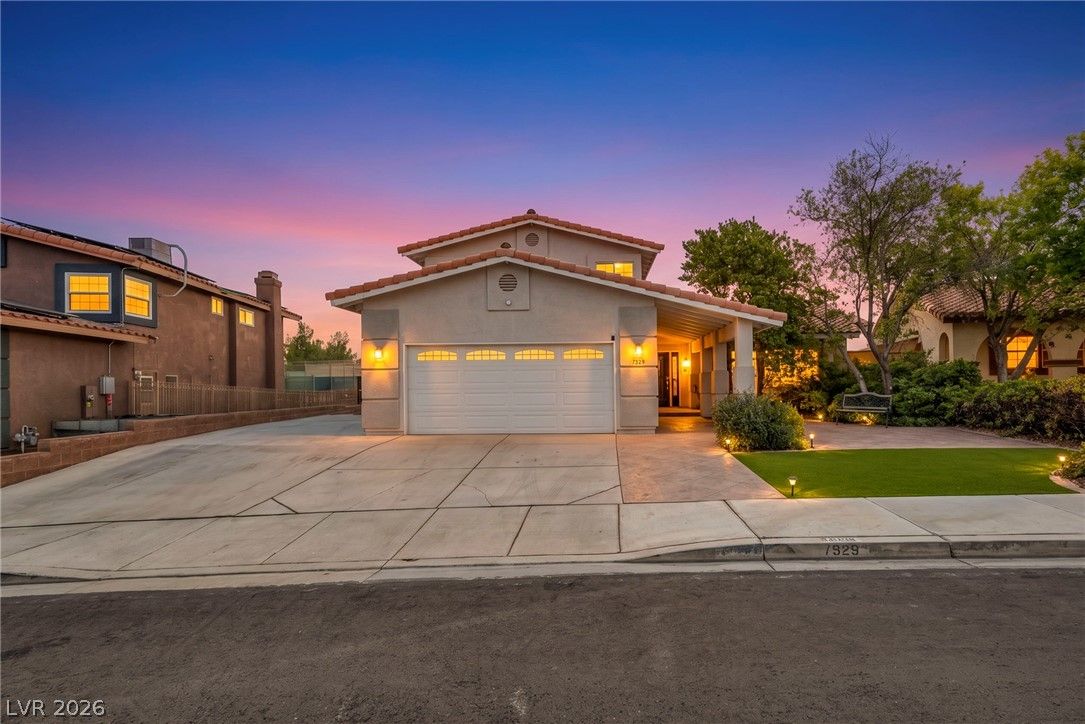
7529 West Gilmore AvenueUnder Contract
$540,0004 bd3 ba2,167 sqft$249/sqft0.82 mi59 days
Nearest comparable sales and listings
12 comparables · median price $479,950 · range $380,000 – $564,999 · median $/sq ft $248 · average $/sq ft $241
| Address | Status | Price | $/Sq Ft | Bd / Ba | Sq Ft | Sold / market time | Distance |
|---|---|---|---|---|---|---|---|
| 6833 High Bluff Way | Active | $460,000 | $247 | 4 / 3 | 1,859 | 1 days on market | 0.23 mi |
| 3305 Irv Marcus Drive | Sold | $515,000 | $229 | 4 / 3 | 2,249 | Sold 2026-07-27 | 0.34 mi |
| 3609 Naugatuck Circle | Active | $564,999 | $259 | 4 / 3 | 2,181 | 38 days on market | 0.36 mi |
| 6700 Bent Wood Court | Sold | $448,000 | $201 | 3 / 3 | 2,233 | Sold 2026-10-16 | 0.41 mi |
| 7129 Deepriver Circle | Active | $449,900 | $201 | 3 / 3 | 2,240 | 58 days on market | 0.43 mi |
| 7120 Maybrook Drive | Sold | $485,000 | $244 | 4 / 3 | 1,990 | Sold 2026-09-28 | 0.50 mi |
| 7504 Grenfell Drive | Sold | $470,000 | $249 | 4 / 2 | 1,888 | Sold 2026-04-29 | 0.66 mi |
| 3836 Marshall Circle | Sold | $380,000 | $219 | 3 / 2 | 1,737 | Sold 2026-09-30 | 0.76 mi |
| 3729 Rockland Drive | Active | $520,000 | $276 | 3 / 2 | 1,884 | 1 days on market | 0.80 mi |
| 7529 West Gilmore Avenue | Under Contract | $540,000 | $249 | 4 / 3 | 2,167 | 59 days on market | 0.82 mi |
| 3709 Broxburn Street | Sold | $474,900 | $263 | 4 / 2 | 1,807 | Sold 2026-08-03 | 0.82 mi |
| 7632 Oyster Cove Drive | Sold | $535,000 | $257 | 4 / 3 | 2,084 | Sold 2026-06-12 | 0.86 mi |


