
Comparable Sales Near 5508 Lochmor Avenue, Las Vegas, NV 89130
1st Realty · Comparable sales report · 1st.estate · October 21, 2026
Browse our Las Vegas area guides →
5508 Lochmor Avenue, Las Vegas, NV 89130
Status: Sold
$453,000 Sold Price
$227
$ / Sq Ft
1,996
Living Area
5,663 sqft
Lot Size
3
Beds
2
Baths
1996
Year Built
Search Parameters
Property Type
Status
Radius
Sold Within
Beds
Baths
Living Area (Sq Ft)
Lot Size (Sq Ft)
This comp search reflects your current search parameters — adjust the filters above as needed for a more accurate estimate.
Estimated Value
—
Average $/Sqft
—
Check one or more comps below to calculate an estimate.
Nearest 10 of 76 comparable sales and listings within 1 mile of this home. Use the filters above and press Search to refine.

$450,0003 bd2 ba1,838 sqft$245/sqft0.08 mi48 daysSold 2026-10-15
$557,0003 bd2 ba1,838 sqft$303/sqft0.12 mi72 daysSold 2026-05-18
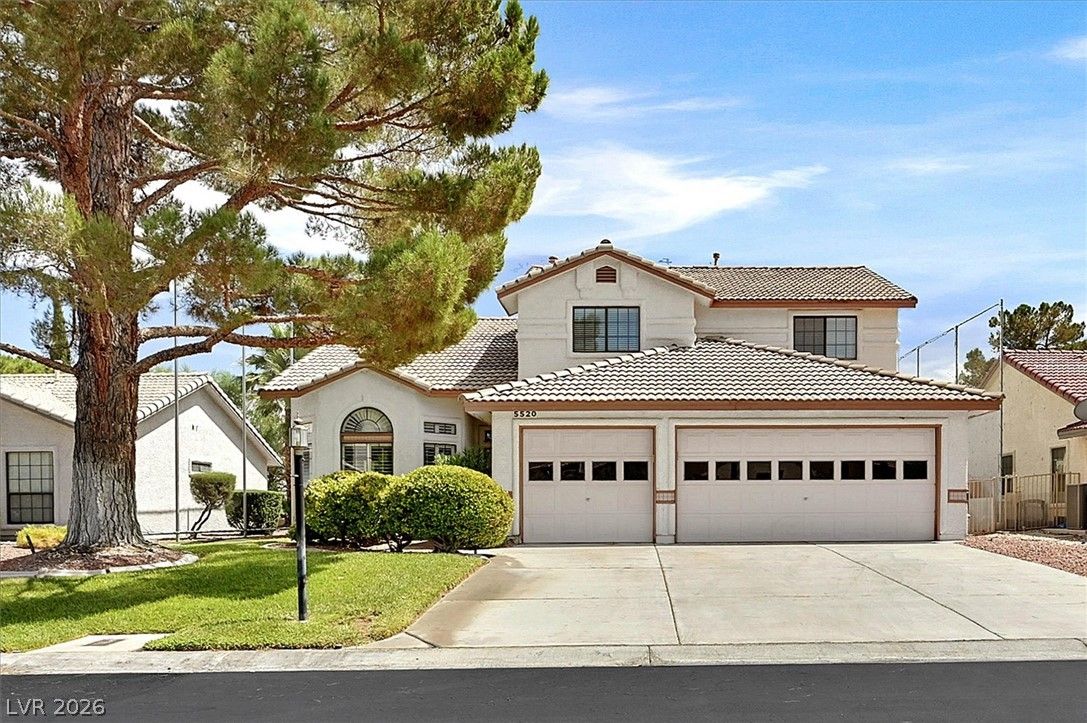
$585,0003 bd3 ba2,443 sqft$239/sqft0.12 mi11 daysSold 2026-09-24
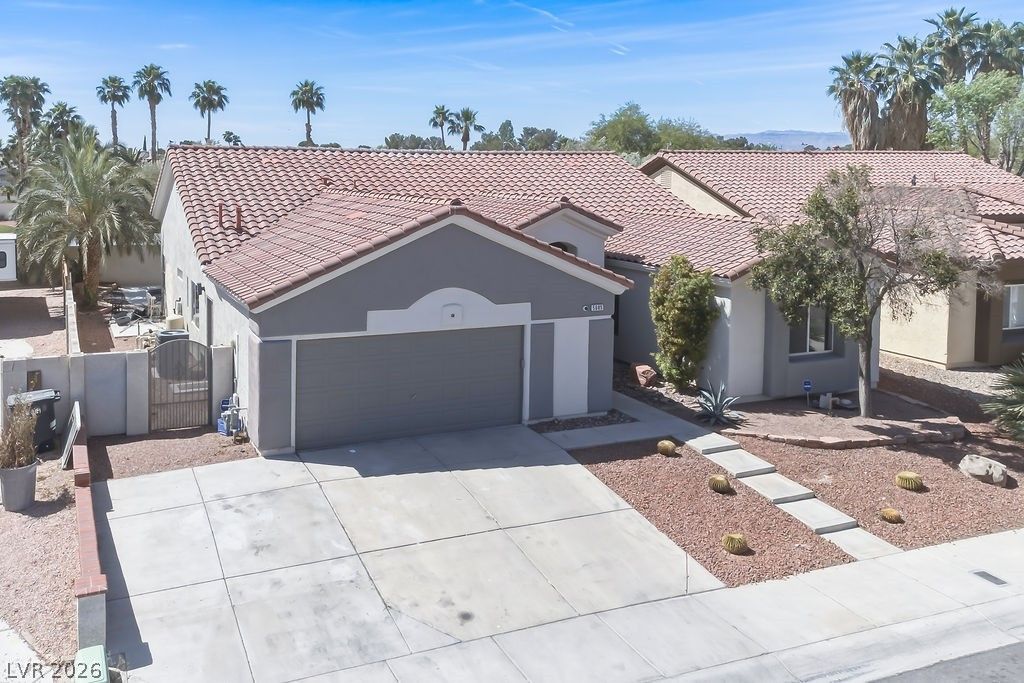
$510,0003 bd3 ba2,002 sqft$255/sqft0.19 mi36 daysSold 2026-07-30
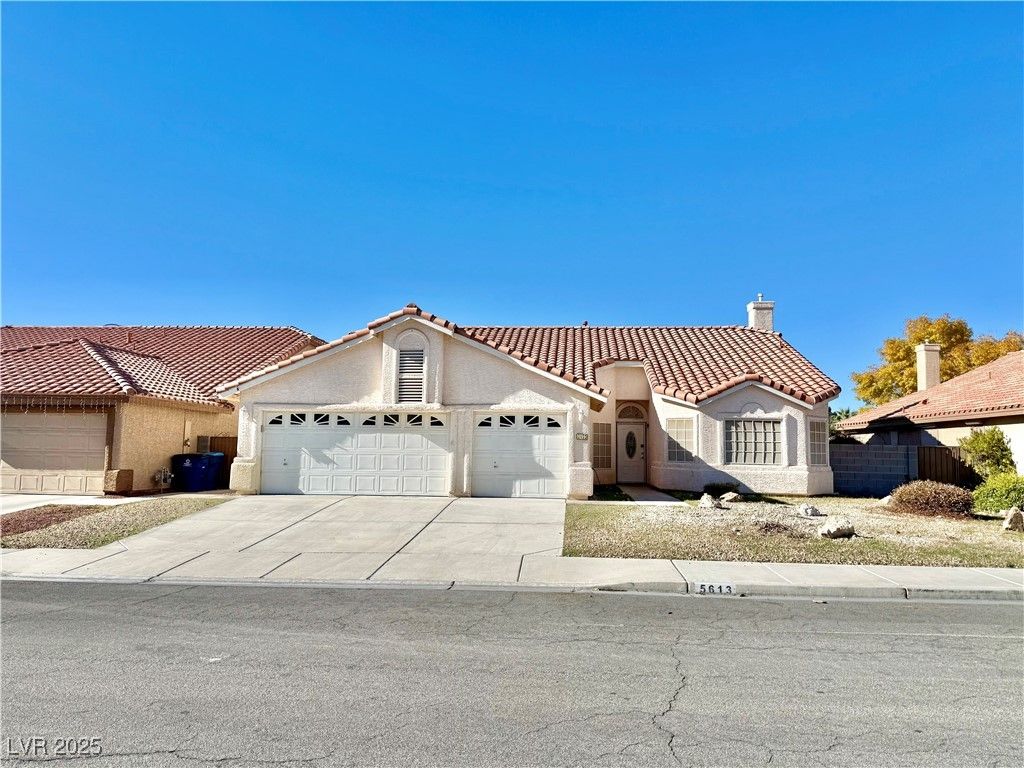
$405,0003 bd2 ba1,662 sqft$244/sqft0.19 mi128 daysSold 2026-08-28
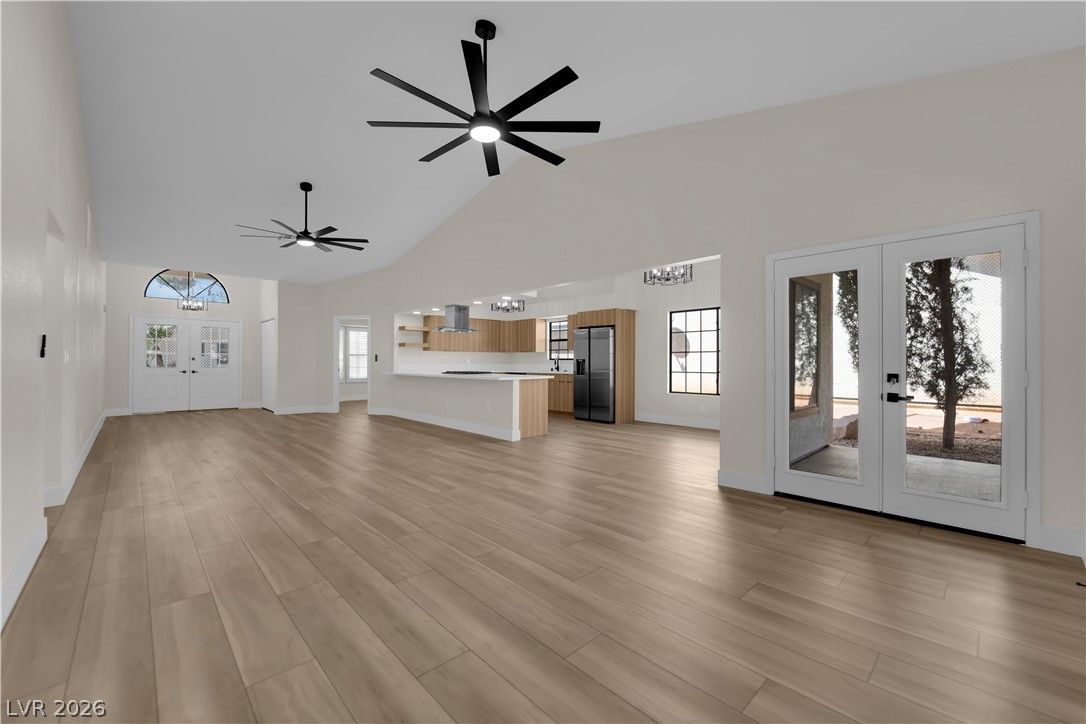
5336 Singing Hills DriveActive
$549,9004 bd2 ba2,007 sqft$274/sqft0.23 mi20 days
$550,0004 bd3 ba2,069 sqft$266/sqft0.25 mi13 daysSold 2026-05-28
$465,0004 bd3 ba2,211 sqft$210/sqft0.25 mi8 daysSold 2026-06-17
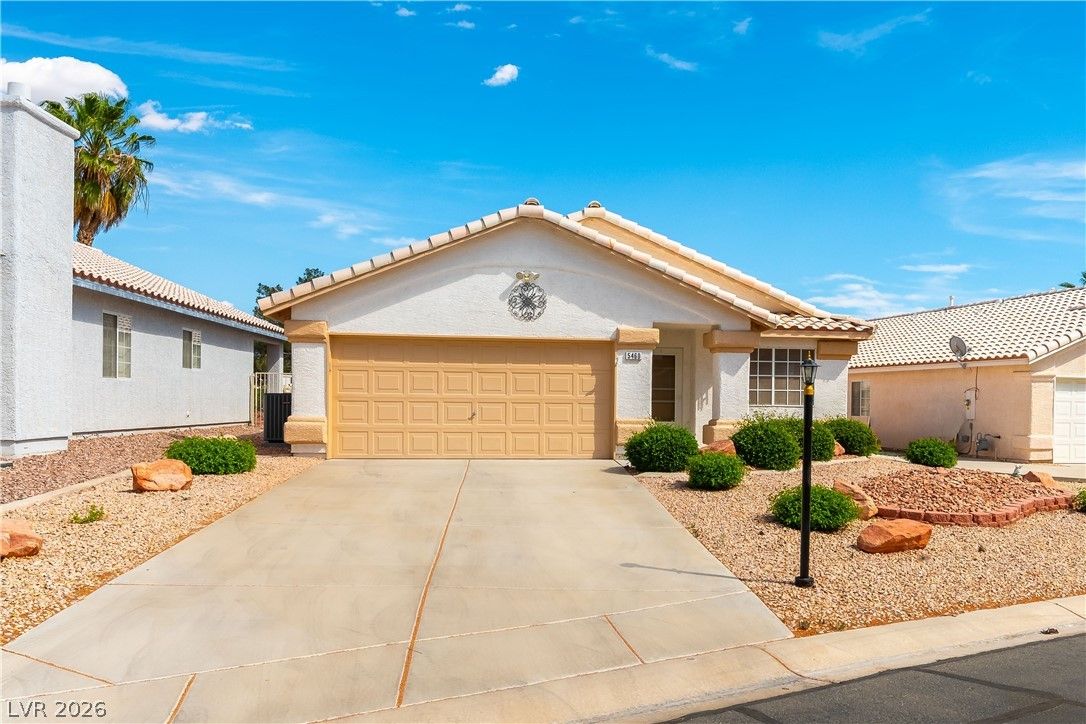
5460 Beach Pine StreetUnder Contract
$399,5003 bd2 ba1,592 sqft$251/sqft0.28 mi169 days
$420,0003 bd2 ba1,554 sqft$270/sqft0.28 mi10 daysSold 2026-05-08
Nearest comparable sales and listings
12 comparables · median price $487,500 · range $399,500 – $585,000 · median $/sq ft $253 · average $/sq ft $257
| Address | Status | Price | $/Sq Ft | Bd / Ba | Sq Ft | Sold / market time | Distance |
|---|---|---|---|---|---|---|---|
| 5421 Desert Paradise Drive | Sold | $450,000 | $245 | 3 / 2 | 1,838 | Sold 2026-10-15 | 0.08 mi |
| 5433 HONEY MESQUITE Lane | Sold | $557,000 | $303 | 3 / 2 | 1,838 | Sold 2026-05-18 | 0.12 mi |
| 5520 Singing Hills Drive | Sold | $585,000 | $239 | 3 / 3 | 2,443 | Sold 2026-09-24 | 0.12 mi |
| 5605 Tropical Toucan Avenue | Sold | $510,000 | $255 | 3 / 3 | 2,002 | Sold 2026-07-30 | 0.19 mi |
| 5613 Partridge Bluff Street | Sold | $405,000 | $244 | 3 / 2 | 1,662 | Sold 2026-08-28 | 0.19 mi |
| 5336 Singing Hills Drive | Active | $549,900 | $274 | 4 / 2 | 2,007 | 20 days on market | 0.23 mi |
| 5428 TINCUP Drive | Sold | $550,000 | $266 | 4 / 3 | 2,069 | Sold 2026-05-28 | 0.25 mi |
| 5416 Rusty Anchor Court | Sold | $465,000 | $210 | 4 / 3 | 2,211 | Sold 2026-06-17 | 0.25 mi |
| 5460 Beach Pine Street | Under Contract | $399,500 | $251 | 3 / 2 | 1,592 | 169 days on market | 0.28 mi |
| 5521 Tincup Drive | Sold | $420,000 | $270 | 3 / 2 | 1,554 | Sold 2026-05-08 | 0.28 mi |
| 5456 Beach Pine Street | Sold | $425,000 | $247 | 3 / 2 | 1,722 | Sold 2026-08-31 | 0.28 mi |
| 5520 Cranwood Court | Sold | $515,000 | $280 | 3 / 2 | 1,838 | Sold 2026-04-30 | 0.33 mi |


