
Comparable Sales Near 8200 Ocean Gate Way, Las Vegas, NV 89128
1st Realty · Comparable sales report · 1st.estate · October 21, 2026
Browse our Las Vegas area guides →
8200 Ocean Gate Way, Las Vegas, NV 89128
Status: Sold
$663,000 Sold Price
$277
$ / Sq Ft
2,393
Living Area
9,148 sqft
Lot Size
3
Beds
2
Baths
1990
Year Built
Search Parameters
Property Type
Status
Radius
Sold Within
Beds
Baths
Living Area (Sq Ft)
Lot Size (Sq Ft)
This comp search reflects your current search parameters — adjust the filters above as needed for a more accurate estimate.
Estimated Value
—
Average $/Sqft
—
Check one or more comps below to calculate an estimate.
Nearest 10 of 32 comparable sales and listings within 1 mile of this home. Use the filters above and press Search to refine.
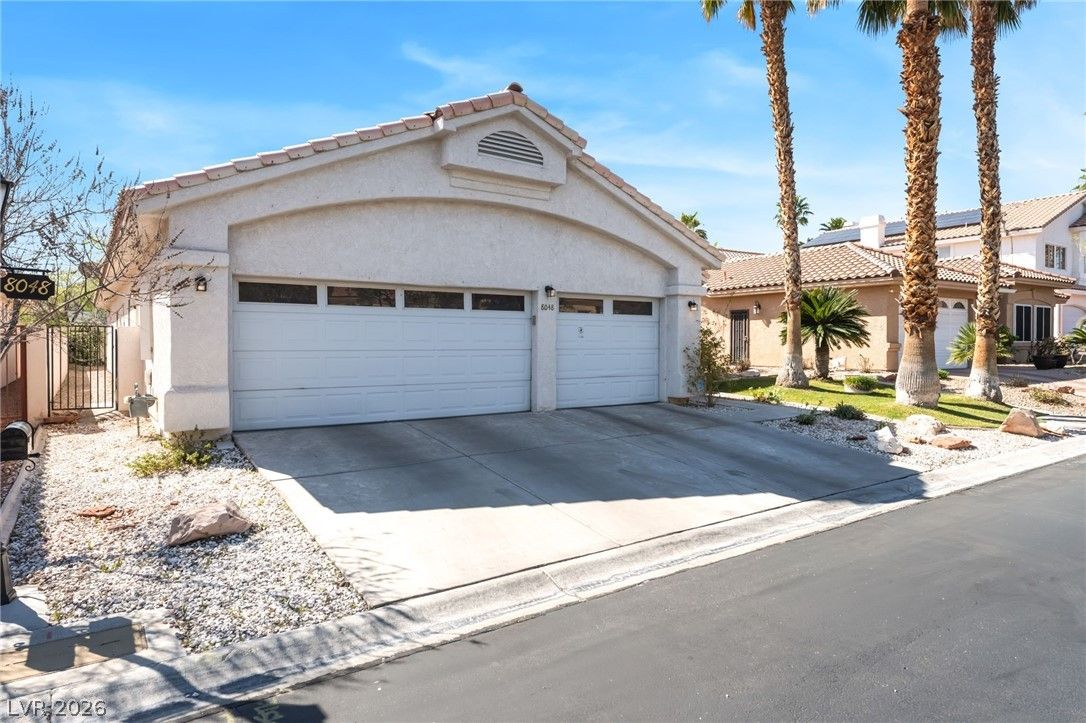
8048 Marbella CircleActive
$629,9003 bd3 ba2,849 sqft$221/sqft0.26 mi186 days

2305 Bear Valley StreetUnder Contract
$599,0003 bd3 ba2,478 sqft$242/sqft0.30 mi40 days
$430,0002 bd3 ba1,968 sqft$218/sqft0.37 mi5 daysSold 2026-06-25

2117 White Falls StreetUnder Contract
$624,9904 bd3 ba2,347 sqft$266/sqft0.43 mi47 days
$700,0004 bd3 ba2,347 sqft$298/sqft0.45 mi109 daysSold 2026-07-20
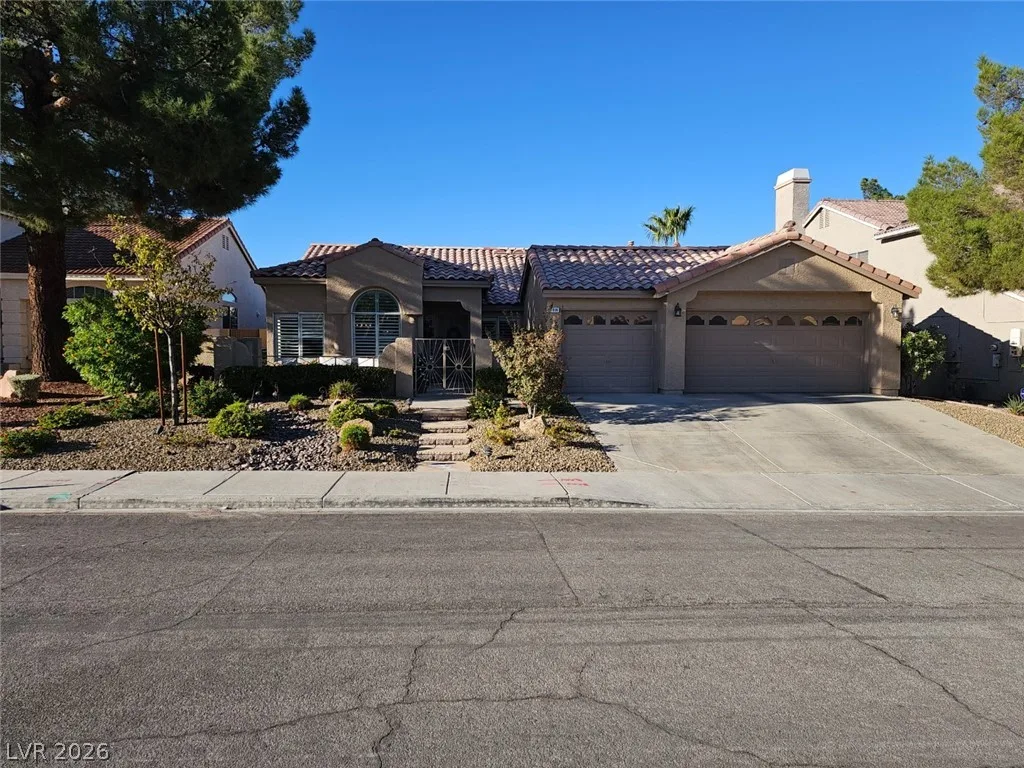
7908 Waterfalls AvenueActive
$664,9004 bd3 ba2,347 sqft$283/sqft0.47 mi0 days
$1,195,0004 bd3 ba2,419 sqft$494/sqft0.48 mi54 daysSold 2026-05-29

7628 Belmondo LaneActive
$629,9004 bd3 ba2,663 sqft$237/sqft0.50 mi61 days
$570,0004 bd3 ba2,347 sqft$243/sqft0.51 mi49 daysSold 2026-05-26
$515,0004 bd3 ba2,347 sqft$219/sqft0.53 mi110 daysSold 2026-07-23
Nearest comparable sales and listings
12 comparables · median price $629,900 · range $430,000 – $1,195,000 · median $/sq ft $255 · average $/sq ft $285
| Address | Status | Price | $/Sq Ft | Bd / Ba | Sq Ft | Sold / market time | Distance |
|---|---|---|---|---|---|---|---|
| 8048 Marbella Circle | Active | $629,900 | $221 | 3 / 3 | 2,849 | 186 days on market | 0.26 mi |
| 2305 Bear Valley Street | Under Contract | $599,000 | $242 | 3 / 3 | 2,478 | 40 days on market | 0.30 mi |
| 2536 Seascape Drive | Sold | $430,000 | $218 | 2 / 3 | 1,968 | Sold 2026-06-25 | 0.37 mi |
| 2117 White Falls Street | Under Contract | $624,990 | $266 | 4 / 3 | 2,347 | 47 days on market | 0.43 mi |
| 2105 Interbay Street | Sold | $700,000 | $298 | 4 / 3 | 2,347 | Sold 2026-07-20 | 0.45 mi |
| 7908 Waterfalls Avenue | Active | $664,900 | $283 | 4 / 3 | 2,347 | 0 days on market | 0.47 mi |
| 2812 Sterling Cove Drive | Sold | $1,195,000 | $494 | 4 / 3 | 2,419 | Sold 2026-05-29 | 0.48 mi |
| 7628 Belmondo Lane | Active | $629,900 | $237 | 4 / 3 | 2,663 | 61 days on market | 0.50 mi |
| 7901 Waterfalls Avenue | Sold | $570,000 | $243 | 4 / 3 | 2,347 | Sold 2026-05-26 | 0.51 mi |
| 8113 Tropic Isle Circle | Sold | $515,000 | $219 | 4 / 3 | 2,347 | Sold 2026-07-23 | 0.53 mi |
| 2832 Summer Lake Drive | Active | $825,000 | $341 | 4 / 3 | 2,419 | 4 days on market | 0.54 mi |
| 2453 Desert Sands Drive | Active | $640,000 | $354 | 2 / 2 | 1,809 | 0 days on market | 0.56 mi |


