
Comparable Sales Near 4929 Signal Drive, Las Vegas, NV 89130
1st Realty · Comparable sales report · 1st.estate · October 21, 2026
Browse our Las Vegas area guides →
4929 Signal Drive, Las Vegas, NV 89130
Status: Sold
$2,045 Sold Price
$1
$ / Sq Ft
1,498
Living Area
9,148 sqft
Lot Size
2
Beds
2
Baths
1994
Year Built
Search Parameters
Property Type
Status
Radius
Sold Within
Beds
Baths
Living Area (Sq Ft)
Lot Size (Sq Ft)
This comp search reflects your current search parameters — adjust the filters above as needed for a more accurate estimate.
Estimated Value
—
Average $/Sqft
—
Check one or more comps below to calculate an estimate.
Nearest 10 of 32 comparable sales and listings within 1 mile of this home. Use the filters above and press Search to refine.

$425,0002 bd2 ba1,534 sqft$277/sqft0.13 mi5 daysSold 2026-10-15
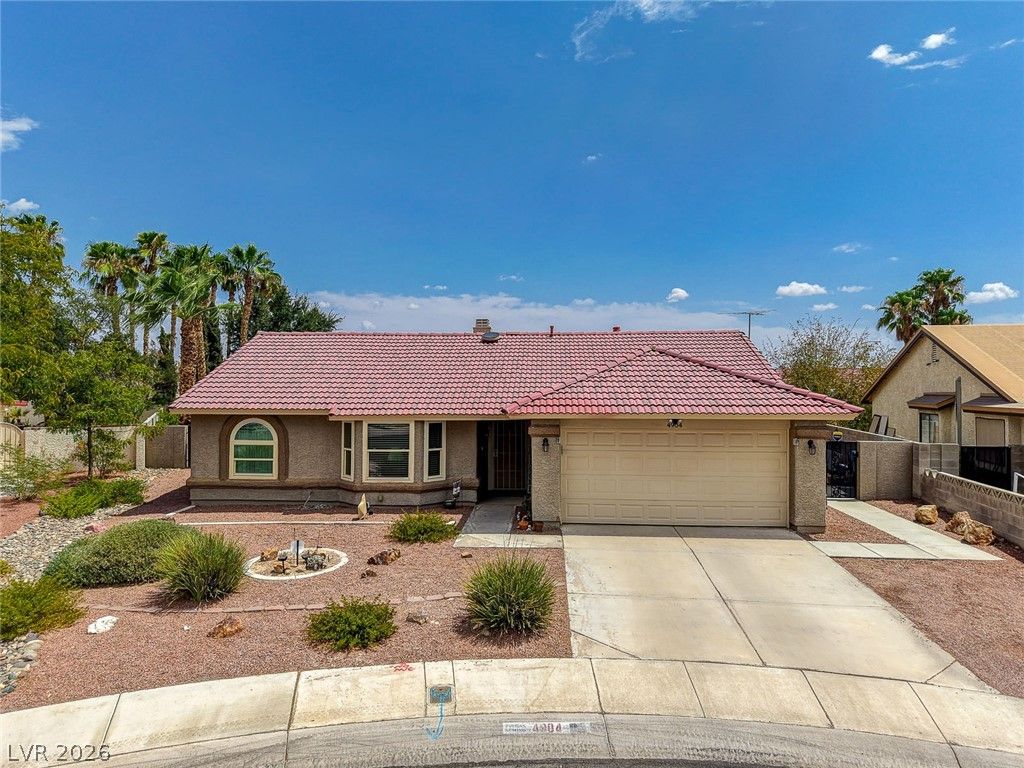
$475,0003 bd2 ba1,627 sqft$292/sqft0.25 mi9 daysSold 2026-09-23
$455,0003 bd2 ba1,445 sqft$315/sqft0.27 mi5 daysSold 2026-07-28
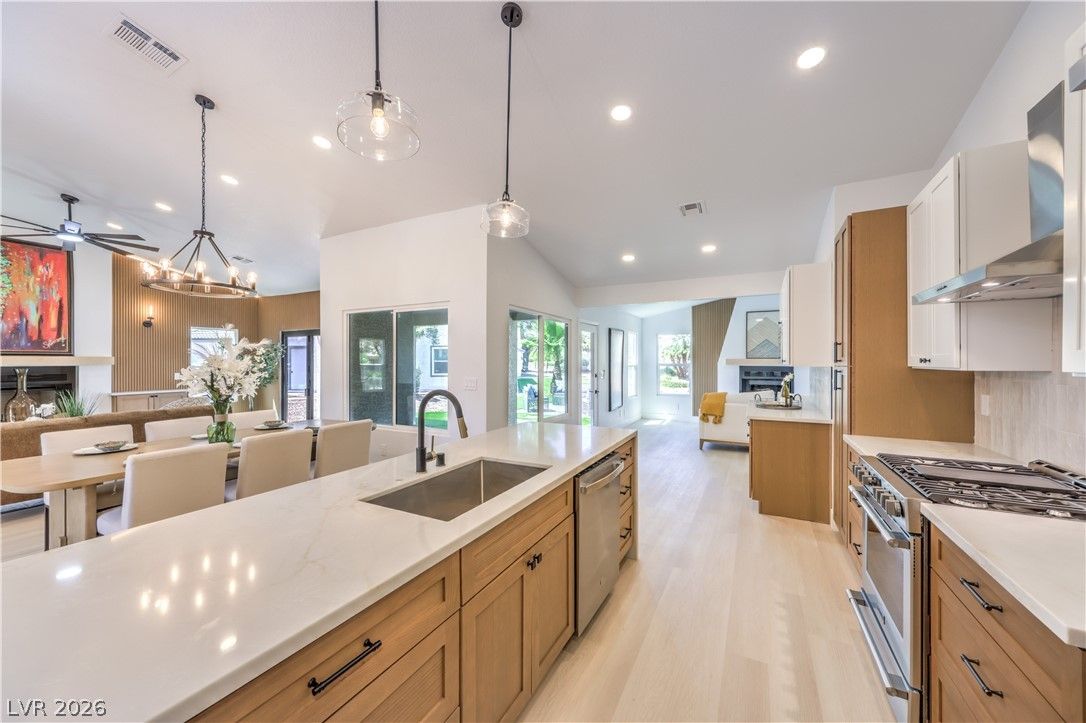
$560,0002 bd2 ba1,731 sqft$324/sqft0.28 mi37 daysSold 2026-07-31
$410,0003 bd2 ba1,586 sqft$259/sqft0.34 mi34 daysSold 2026-05-26
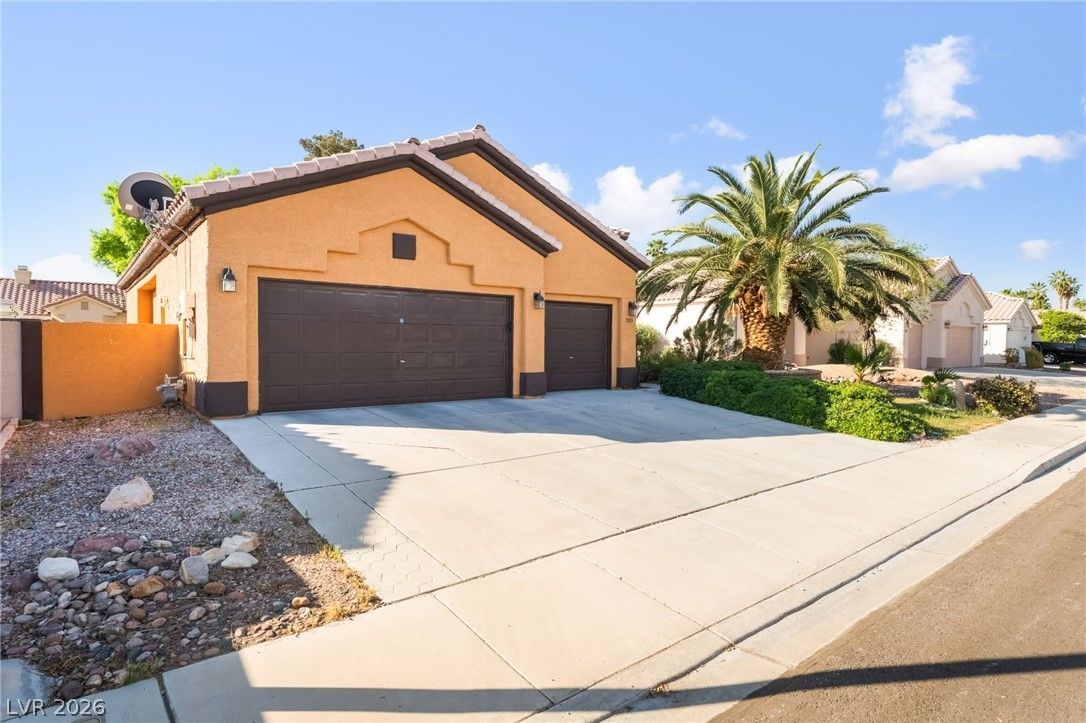
$410,0003 bd2 ba1,833 sqft$224/sqft0.36 mi52 daysSold 2026-09-15
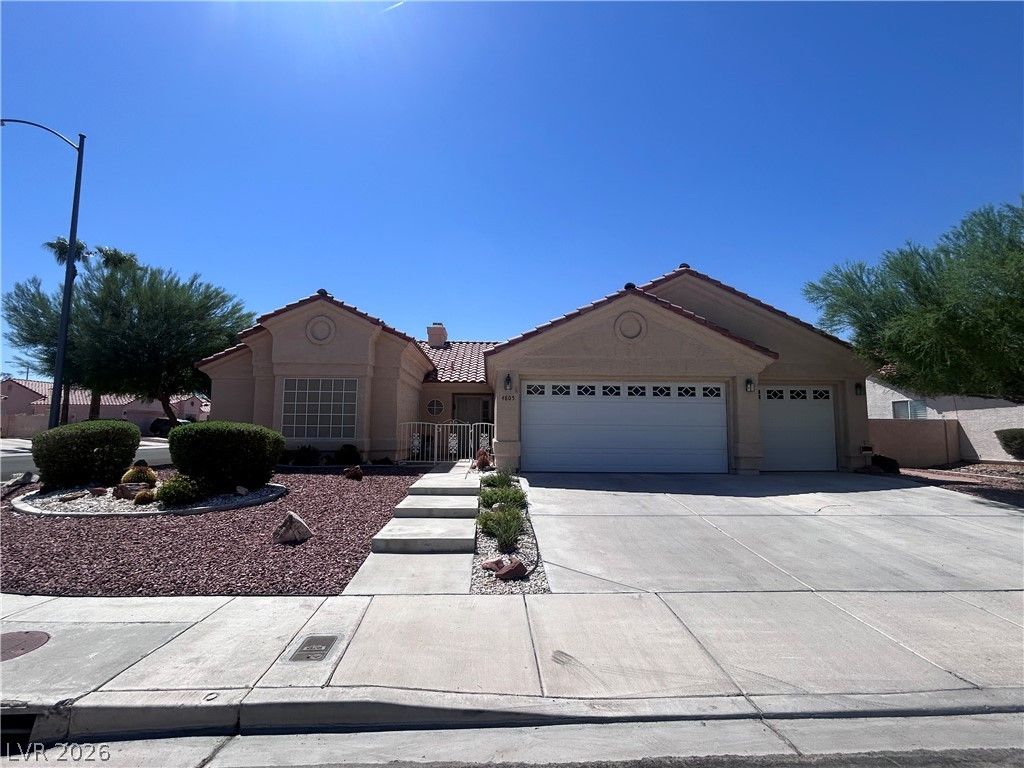
$370,0003 bd2 ba1,580 sqft$234/sqft0.38 mi3 daysSold 2026-09-24
$450,0003 bd2 ba1,574 sqft$286/sqft0.39 mi24 daysSold 2026-06-26
$420,0002 bd2 ba1,610 sqft$261/sqft0.41 mi88 daysSold 2026-07-01
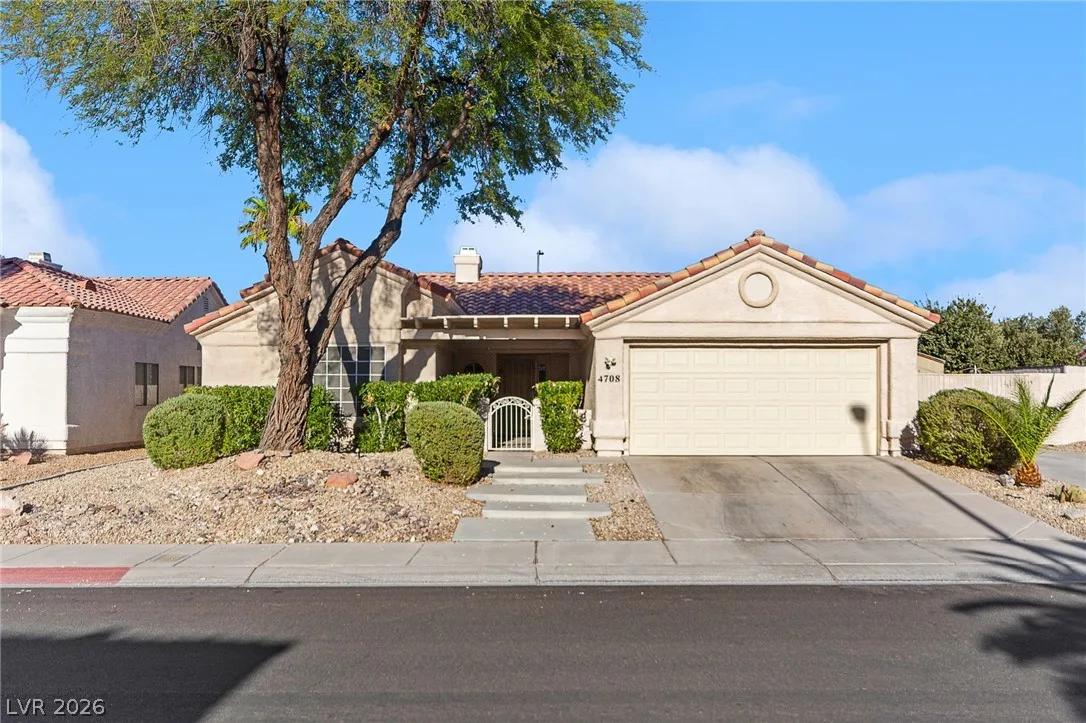
4708 Standing Bluff WayActive
$520,0003 bd2 ba1,586 sqft$328/sqft0.44 mi0 days
Nearest comparable sales and listings
12 comparables · median price $430,000 · range $370,000 – $560,000 · median $/sq ft $271 · average $/sq ft $276
| Address | Status | Price | $/Sq Ft | Bd / Ba | Sq Ft | Sold / market time | Distance |
|---|---|---|---|---|---|---|---|
| 5008 Deep Forest Drive | Sold | $425,000 | $277 | 2 / 2 | 1,534 | Sold 2026-10-15 | 0.13 mi |
| 4904 Needles Court | Sold | $475,000 | $292 | 3 / 2 | 1,627 | Sold 2026-09-23 | 0.25 mi |
| 4813 Holly Grove Drive | Sold | $455,000 | $315 | 3 / 2 | 1,445 | Sold 2026-07-28 | 0.27 mi |
| 5001 Pacific Grove Drive | Sold | $560,000 | $324 | 2 / 2 | 1,731 | Sold 2026-07-31 | 0.28 mi |
| 4724 Victoria Beach Way | Sold | $410,000 | $259 | 3 / 2 | 1,586 | Sold 2026-05-26 | 0.34 mi |
| 5213 Red Glory Drive | Sold | $410,000 | $224 | 3 / 2 | 1,833 | Sold 2026-09-15 | 0.36 mi |
| 4805 Crimson Glory Lane | Sold | $370,000 | $234 | 3 / 2 | 1,580 | Sold 2026-09-24 | 0.38 mi |
| 4637 Gonzales Drive | Sold | $450,000 | $286 | 3 / 2 | 1,574 | Sold 2026-06-26 | 0.39 mi |
| 5609 Cape Coral Circle | Sold | $420,000 | $261 | 2 / 2 | 1,610 | Sold 2026-07-01 | 0.41 mi |
| 4708 Standing Bluff Way | Active | $520,000 | $328 | 3 / 2 | 1,586 | 0 days on market | 0.44 mi |
| 5621 Lost Tree Circle | Active | $435,000 | $247 | 3 / 2 | 1,764 | 0 days on market | 0.45 mi |
| 4821 Wind Break Lane | Sold | $396,000 | $265 | 3 / 2 | 1,492 | Sold 2026-09-03 | 0.48 mi |


