
Comparable Sales Near 8701 Sandringham Avenue, Las Vegas, NV 89129
1st Realty · Comparable sales report · 1st.estate · October 21, 2026
Browse our Las Vegas area guides →
8701 Sandringham Avenue, Las Vegas, NV 89129
Status: Sold
$330,000 Sold Price
$236
$ / Sq Ft
1,400
Living Area
2,614 sqft
Lot Size
3
Beds
3
Baths
1999
Year Built
Search Parameters
Property Type
Status
Radius
Sold Within
Beds
Baths
Living Area (Sq Ft)
Lot Size (Sq Ft)
This comp search reflects your current search parameters — adjust the filters above as needed for a more accurate estimate.
Estimated Value
—
Average $/Sqft
—
Check one or more comps below to calculate an estimate.
Nearest 10 of 13 comparable sales and listings within 1 mile of this home. Use the filters above and press Search to refine.
$350,0003 bd3 ba1,347 sqft$260/sqft0.01 mi26 daysSold 2026-06-22
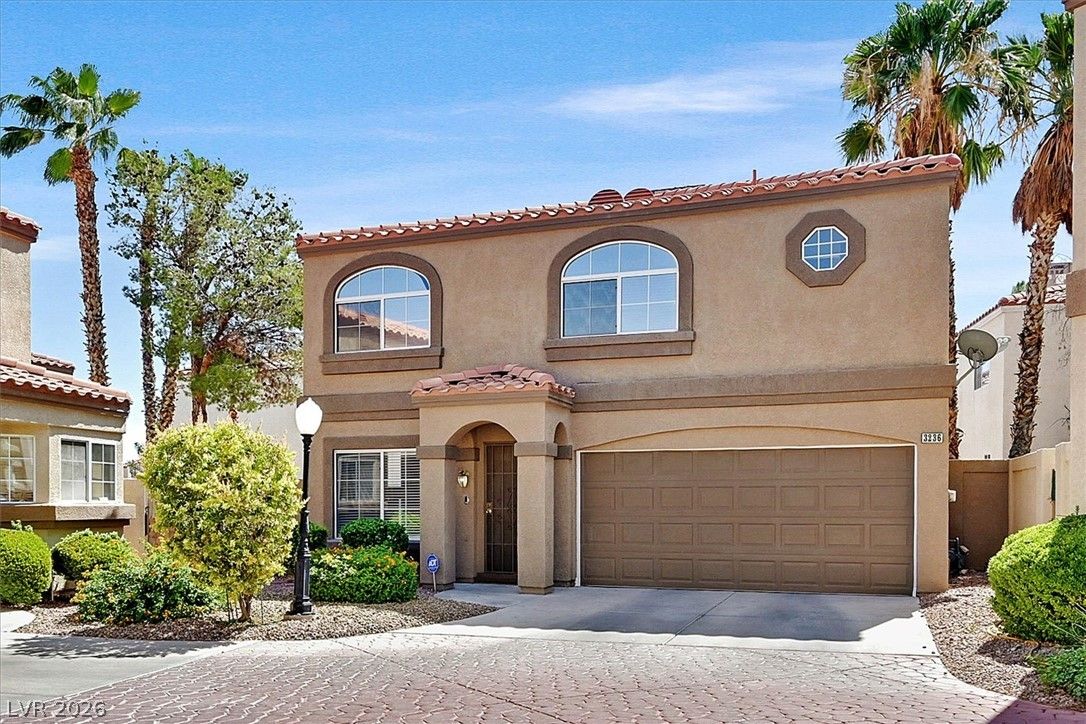
3236 Cheltenham StreetActive
$375,0003 bd3 ba1,621 sqft$231/sqft0.09 mi20 days
$327,5003 bd3 ba1,621 sqft$202/sqft0.14 mi6 daysSold 2026-07-17
3303 CheltenhamSold
$365,0003 bd3 ba1,347 sqft$271/sqft0.15 mi109 daysSold 2026-08-05
$370,0003 bd3 ba1,621 sqft$228/sqft0.20 mi97 daysSold 2026-06-03
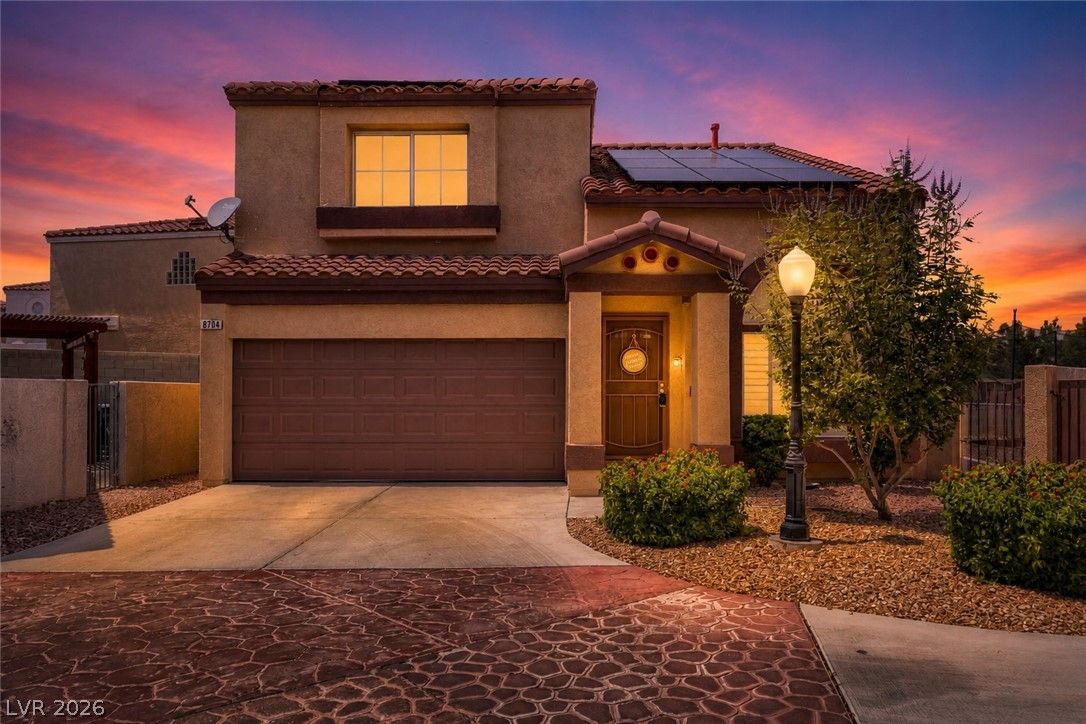
8704 Harwich AvenueActive
$360,0003 bd3 ba1,347 sqft$267/sqft0.24 mi52 days
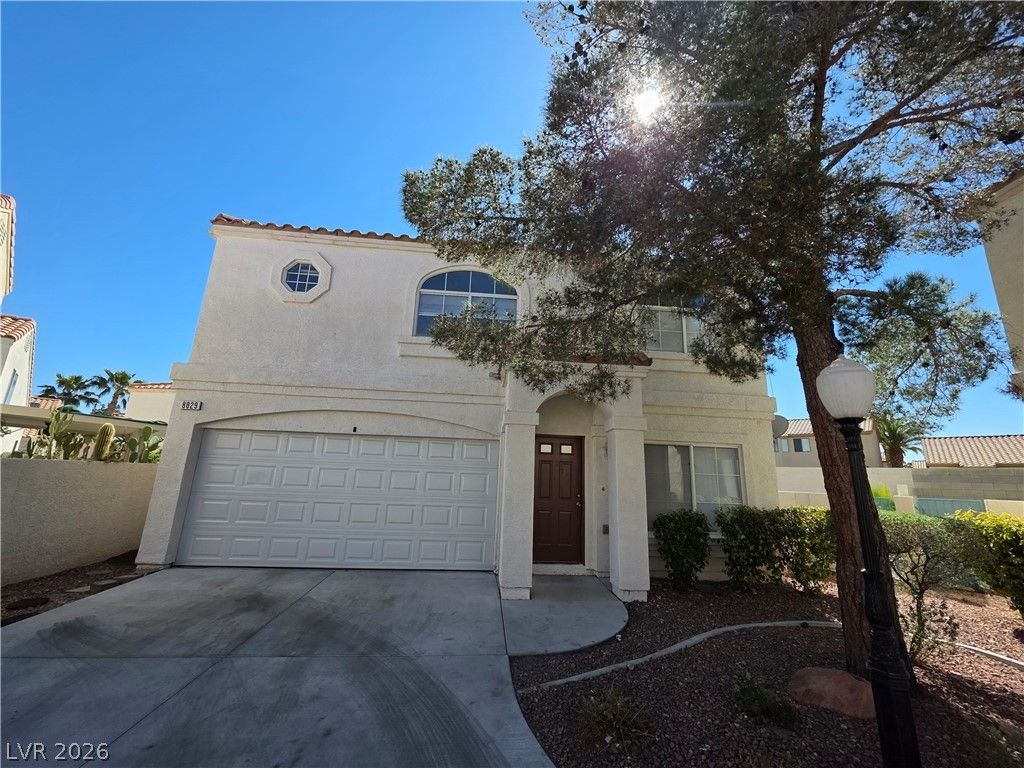
$479,9004 bd3 ba1,621 sqft$296/sqft0.31 mi0 days
$345,0003 bd3 ba1,281 sqft$269/sqft0.42 mi103 daysSold 2026-06-29
$340,0002 bd3 ba1,281 sqft$265/sqft0.42 mi138 daysSold 2026-07-21
$365,0003 bd3 ba1,634 sqft$223/sqft0.43 mi6 daysSold 2026-05-27
Nearest comparable sales and listings
12 comparables · median price $365,000 · range $327,500 – $479,900 · median $/sq ft $256 · average $/sq ft $251
| Address | Status | Price | $/Sq Ft | Bd / Ba | Sq Ft | Sold / market time | Distance |
|---|---|---|---|---|---|---|---|
| 8703 Sandringham Avenue | Sold | $350,000 | $260 | 3 / 3 | 1,347 | Sold 2026-06-22 | 0.01 mi |
| 3236 Cheltenham Street | Active | $375,000 | $231 | 3 / 3 | 1,621 | 20 days on market | 0.09 mi |
| 3324 Epson Street | Sold | $327,500 | $202 | 3 / 3 | 1,621 | Sold 2026-07-17 | 0.14 mi |
| 3303 Cheltenham | Sold | $365,000 | $271 | 3 / 3 | 1,347 | Sold 2026-08-05 | 0.15 mi |
| 3349 Cheltenham Street | Sold | $370,000 | $228 | 3 / 3 | 1,621 | Sold 2026-06-03 | 0.20 mi |
| 8704 Harwich Avenue | Active | $360,000 | $267 | 3 / 3 | 1,347 | 52 days on market | 0.24 mi |
| 8829 CORNWALL GLEN Avenue | Active | $479,900 | $296 | 4 / 3 | 1,621 | 0 days on market | 0.31 mi |
| 3422 Creek River Drive | Sold | $345,000 | $269 | 3 / 3 | 1,281 | Sold 2026-06-29 | 0.42 mi |
| 3431 White Mission Drive | Sold | $340,000 | $265 | 2 / 3 | 1,281 | Sold 2026-07-21 | 0.42 mi |
| 3469 Mariner Beach Drive | Sold | $365,000 | $223 | 3 / 3 | 1,634 | Sold 2026-05-27 | 0.43 mi |
| 8914 Indian Eagle Drive | Pending | $379,999 | $252 | 3 / 3 | 1,508 | 70 days on market | 0.46 mi |
| 9051 Hollow Green Drive | Sold | $365,000 | $242 | 3 / 3 | 1,508 | Sold 2026-08-10 | 0.52 mi |


