
Comparable Sales Near 10389 Calypso Cave Street, Las Vegas, NV 89141
1st Realty · Comparable sales report · 1st.estate · October 21, 2026
Read the Enterprise neighborhood guide →
10389 Calypso Cave Street, Las Vegas, NV 89141
Status: Sold
$1,999 Sold Price
$1
$ / Sq Ft
1,622
Living Area
3,485 sqft
Lot Size
3
Beds
3
Baths
2007
Year Built
Search Parameters
Property Type
Status
Radius
Sold Within
Beds
Baths
Living Area (Sq Ft)
Lot Size (Sq Ft)
This comp search reflects your current search parameters — adjust the filters above as needed for a more accurate estimate.
Estimated Value
—
Average $/Sqft
—
Check one or more comps below to calculate an estimate.
Nearest 10 of 35 comparable sales and listings within 1 mile of this home. Use the filters above and press Search to refine.
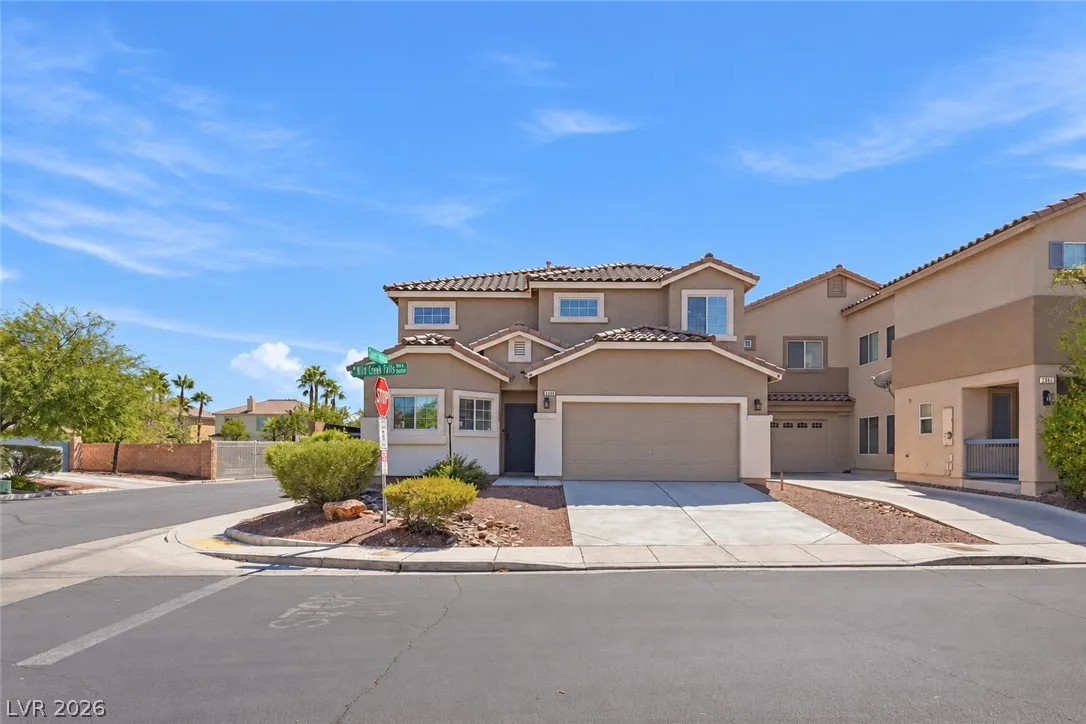
$515,0003 bd3 ba1,996 sqft$258/sqft0.12 mi10 days
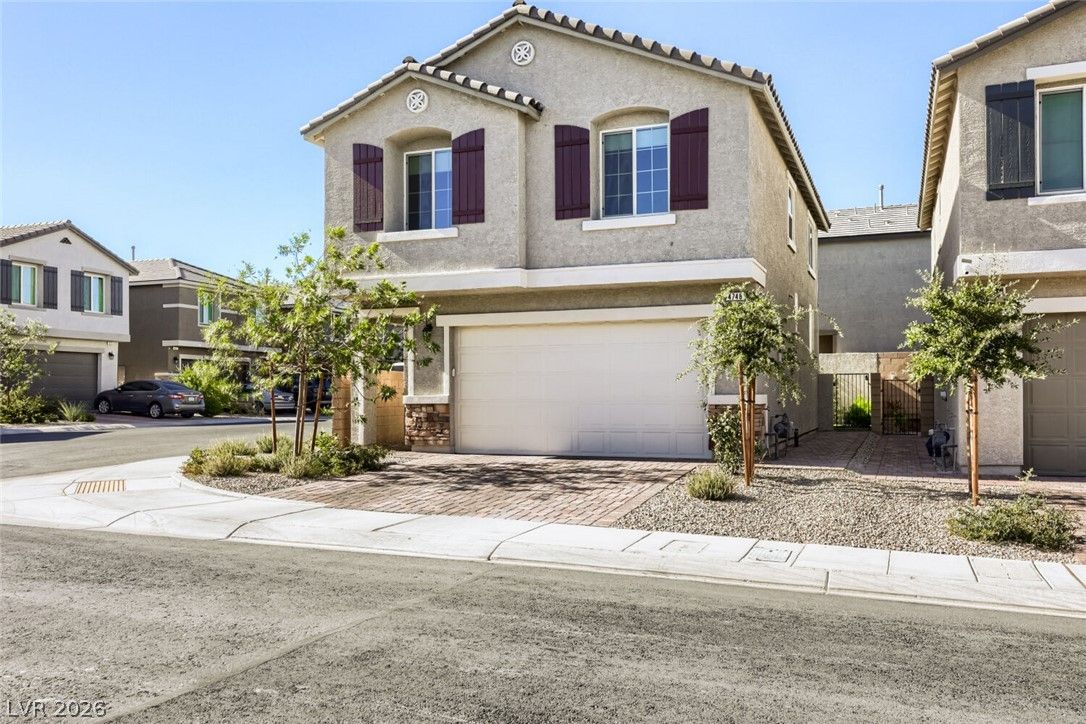
4748 Illustria AvenueActive
$489,9003 bd3 ba1,503 sqft$326/sqft0.29 mi74 days
$515,0003 bd3 ba1,764 sqft$292/sqft0.32 mi12 daysSold 2026-06-05
$555,0003 bd3 ba1,764 sqft$315/sqft0.33 mi20 daysSold 2026-04-30
$525,0004 bd3 ba2,024 sqft$259/sqft0.42 mi19 daysSold 2026-06-01
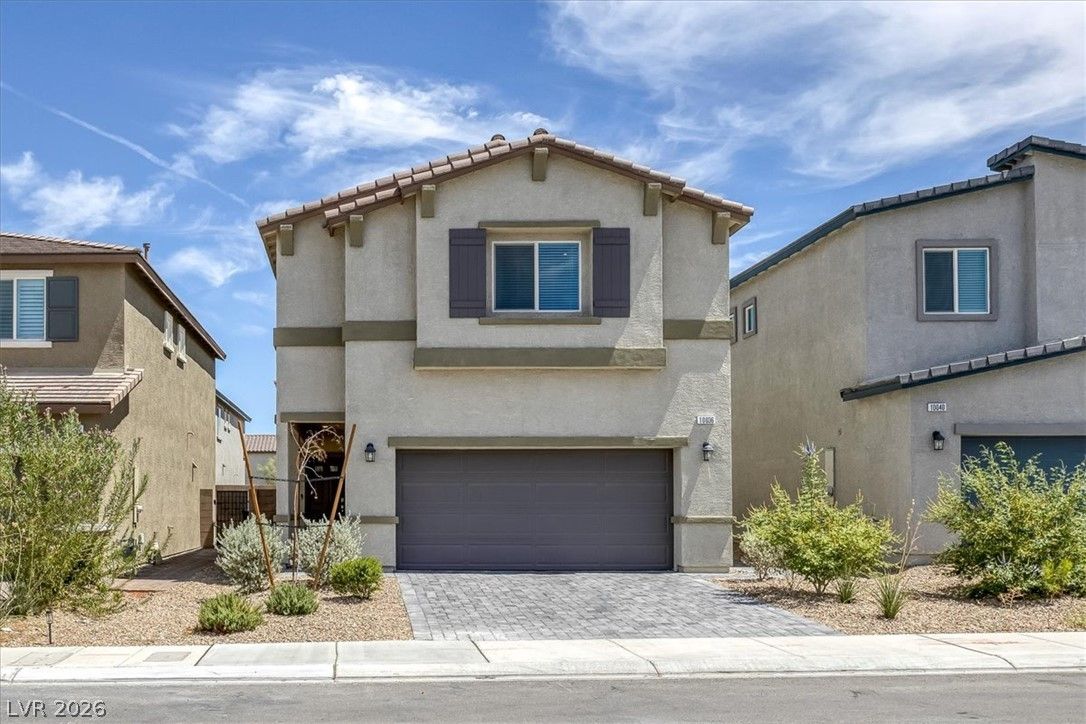
10036 Ullom DriveActive
$475,0004 bd3 ba1,855 sqft$256/sqft0.48 mi23 days

4423 Frias Falls AvenueActive
$490,0003 bd3 ba1,892 sqft$259/sqft0.52 mi71 days
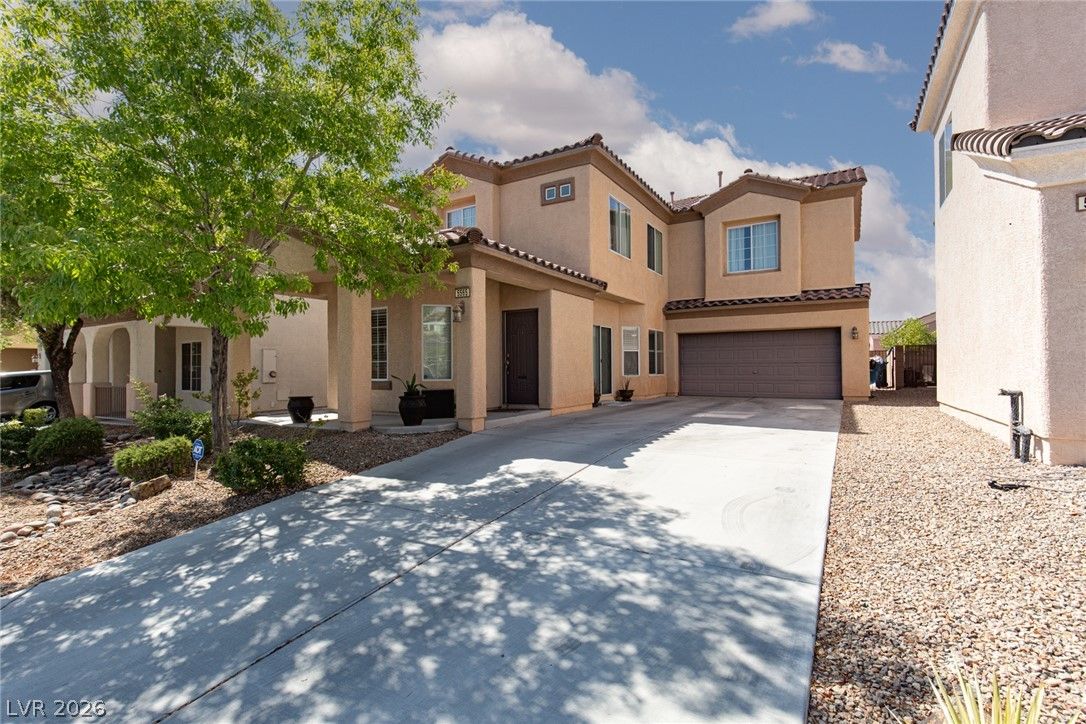
5565 Danforth AvenuePending
$415,0003 bd3 ba1,846 sqft$225/sqft0.52 mi73 days
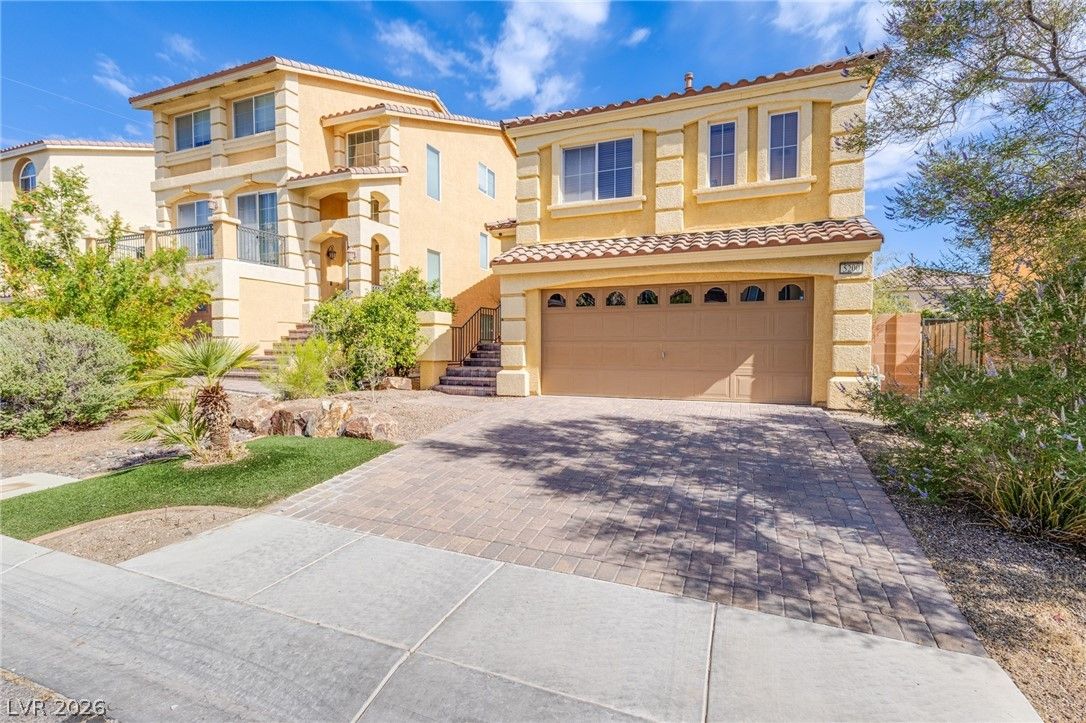
$450,0003 bd2 ba1,967 sqft$229/sqft0.52 mi44 daysSold 2026-07-29

4417 Frias Falls AvenueActive
$485,0003 bd3 ba1,788 sqft$271/sqft0.53 mi25 days
Nearest comparable sales and listings
12 comparables · median price $489,950 · range $415,000 – $555,000 · median $/sq ft $259 · average $/sq ft $267
| Address | Status | Price | $/Sq Ft | Bd / Ba | Sq Ft | Sold / market time | Distance |
|---|---|---|---|---|---|---|---|
| 5005 Wild Creek Falls Way | Active | $515,000 | $258 | 3 / 3 | 1,996 | 10 days on market | 0.12 mi |
| 4748 Illustria Avenue | Active | $489,900 | $326 | 3 / 3 | 1,503 | 74 days on market | 0.29 mi |
| 4616 Chirping Cricket Avenue | Sold | $515,000 | $292 | 3 / 3 | 1,764 | Sold 2026-06-05 | 0.32 mi |
| 10223 Midnight Onyx Street | Sold | $555,000 | $315 | 3 / 3 | 1,764 | Sold 2026-04-30 | 0.33 mi |
| 5018 Bonnie Doon Lane | Sold | $525,000 | $259 | 4 / 3 | 2,024 | Sold 2026-06-01 | 0.42 mi |
| 10036 Ullom Drive | Active | $475,000 | $256 | 4 / 3 | 1,855 | 23 days on market | 0.48 mi |
| 4423 Frias Falls Avenue | Active | $490,000 | $259 | 3 / 3 | 1,892 | 71 days on market | 0.52 mi |
| 5565 Danforth Avenue | Pending | $415,000 | $225 | 3 / 3 | 1,846 | 73 days on market | 0.52 mi |
| 5200 Plymouth Bay Court | Sold | $450,000 | $229 | 3 / 2 | 1,967 | Sold 2026-07-29 | 0.52 mi |
| 4417 Frias Falls Avenue | Active | $485,000 | $271 | 3 / 3 | 1,788 | 25 days on market | 0.53 mi |
| 10031 Cameron Street | Sold | $470,000 | $261 | 4 / 3 | 1,802 | Sold 2026-04-30 | 0.53 mi |
| 10201 Beckenham Hills Street | Active | $515,000 | $258 | 3 / 2 | 1,994 | 91 days on market | 0.54 mi |


