
Comparable Sales Near 3933 Herford Lane, Las Vegas, NV 89110
1st Realty · Comparable sales report · 1st.estate · October 21, 2026
Browse our Las Vegas area guides →
3933 Herford Lane, Las Vegas, NV 89110
Status: Sold
$300,000 Sold Price
$260
$ / Sq Ft
1,152
Living Area
4,792 sqft
Lot Size
3
Beds
2
Baths
1987
Year Built
Search Parameters
Property Type
Status
Radius
Sold Within
Beds
Baths
Living Area (Sq Ft)
Lot Size (Sq Ft)
This comp search reflects your current search parameters — adjust the filters above as needed for a more accurate estimate.
Estimated Value
—
Average $/Sqft
—
Check one or more comps below to calculate an estimate.
Nearest 9 of 9 comparable sales and listings within 1 mile of this home. Use the filters above and press Search to refine.
$343,0002 bd2 ba1,095 sqft$313/sqft0.04 mi6 daysSold 2026-04-27
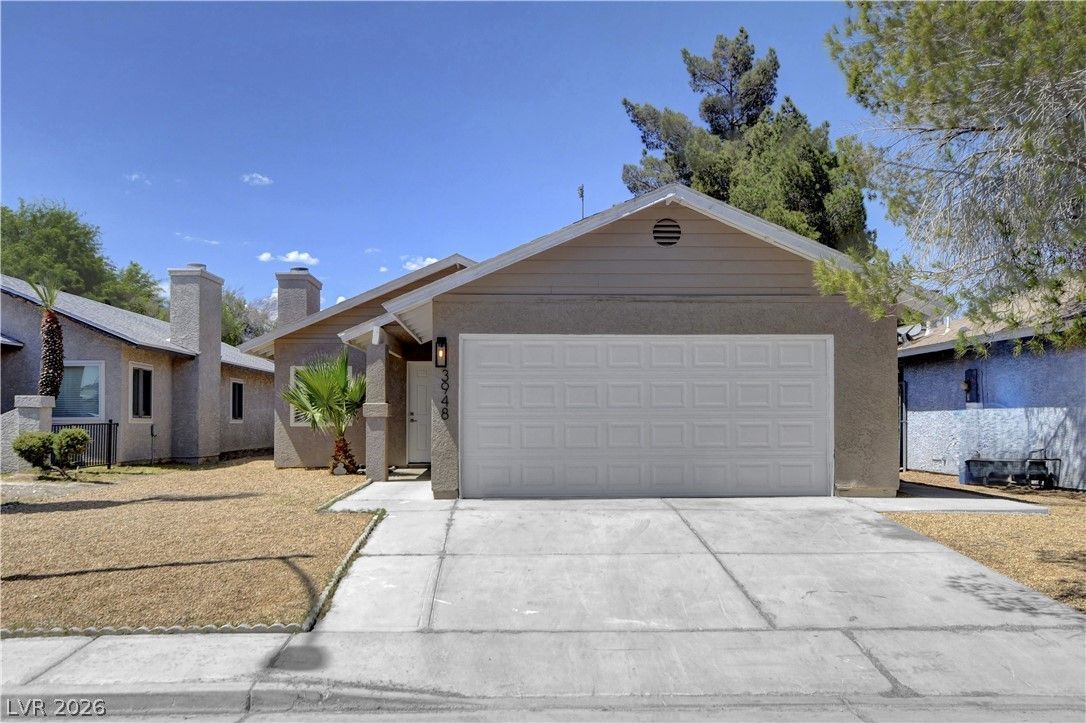
$360,0003 bd2 ba1,152 sqft$313/sqft0.10 mi50 daysSold 2026-09-09
$355,0003 bd3 ba1,423 sqft$249/sqft0.26 mi3 daysSold 2026-06-10
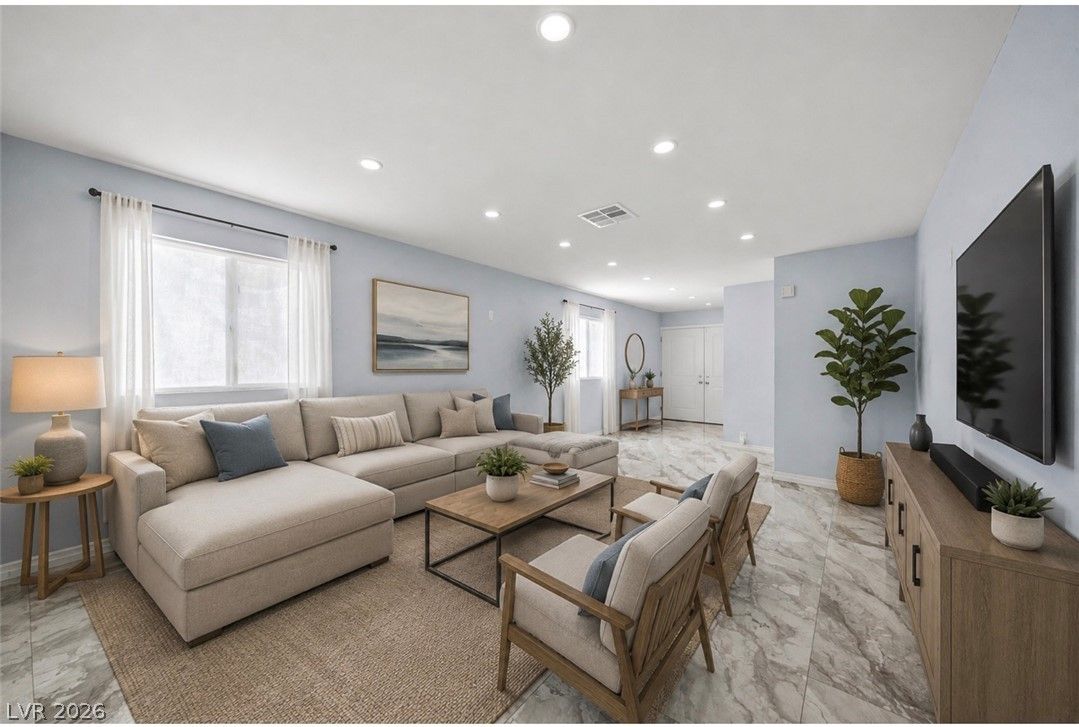
$382,0003 bd2 ba1,236 sqft$309/sqft0.35 mi14 daysSold 2026-09-02

$318,0003 bd2 ba1,072 sqft$297/sqft0.38 mi58 daysSold 2026-10-08
$374,0003 bd2 ba1,235 sqft$303/sqft0.49 mi28 daysSold 2026-06-10
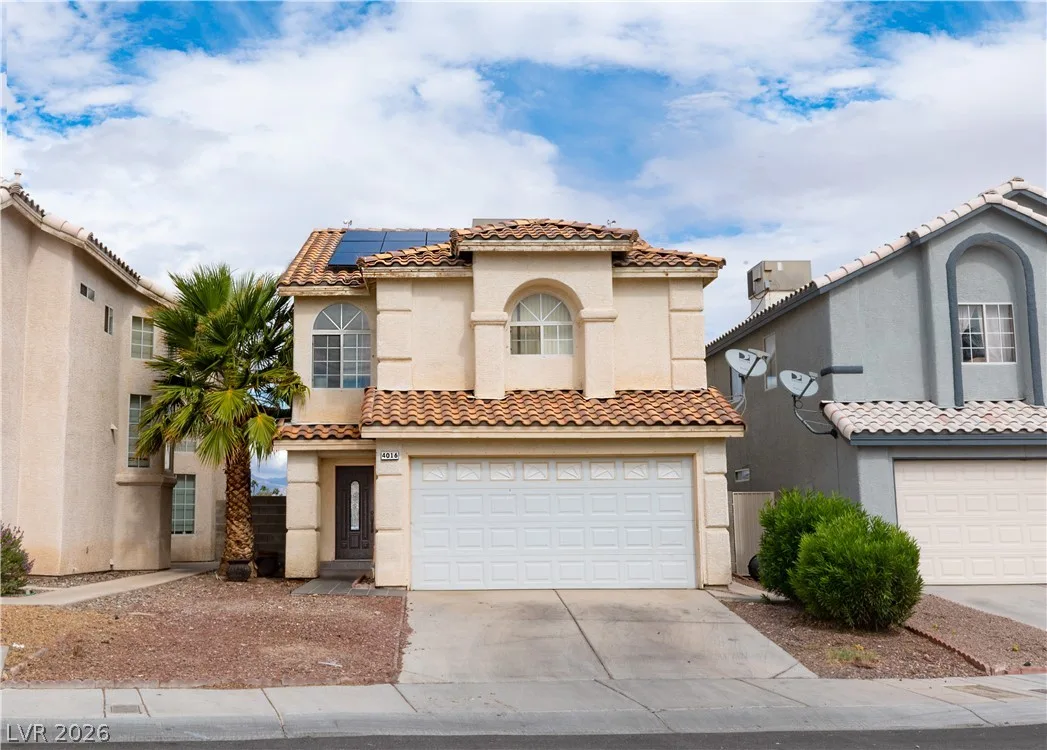
4016 Abrams AvenueActive
$365,0003 bd3 ba1,400 sqft$261/sqft0.51 mi0 days
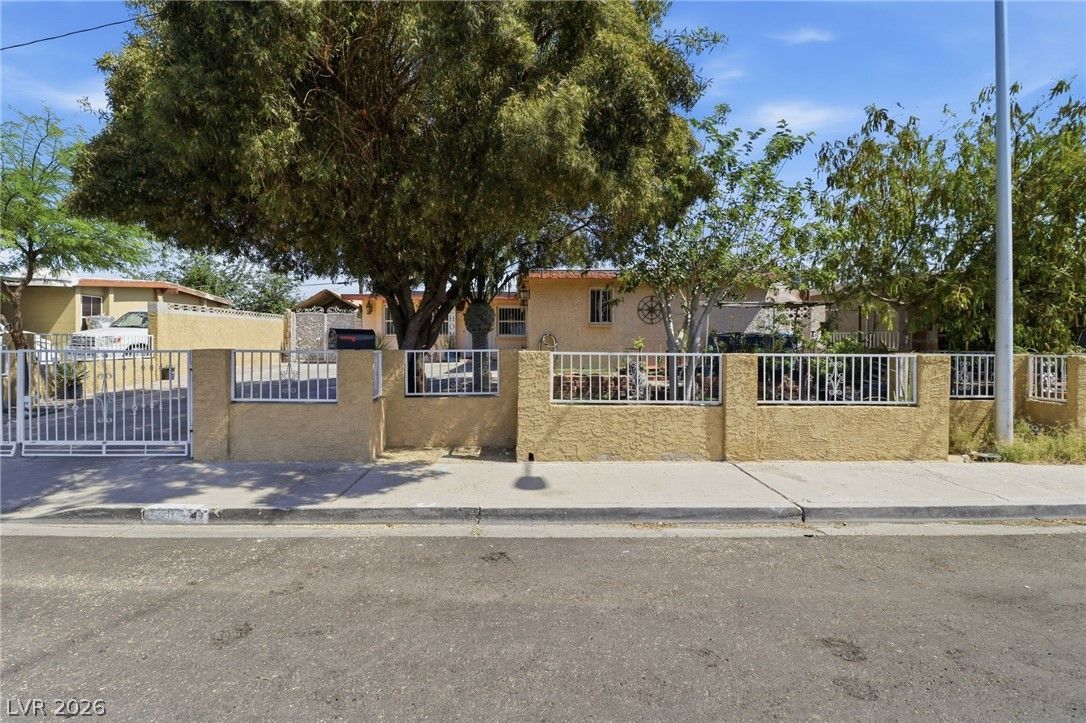
3601 Chevy Chase AvenueActive
$360,0013 bd2 ba1,218 sqft$296/sqft0.65 mi79 days
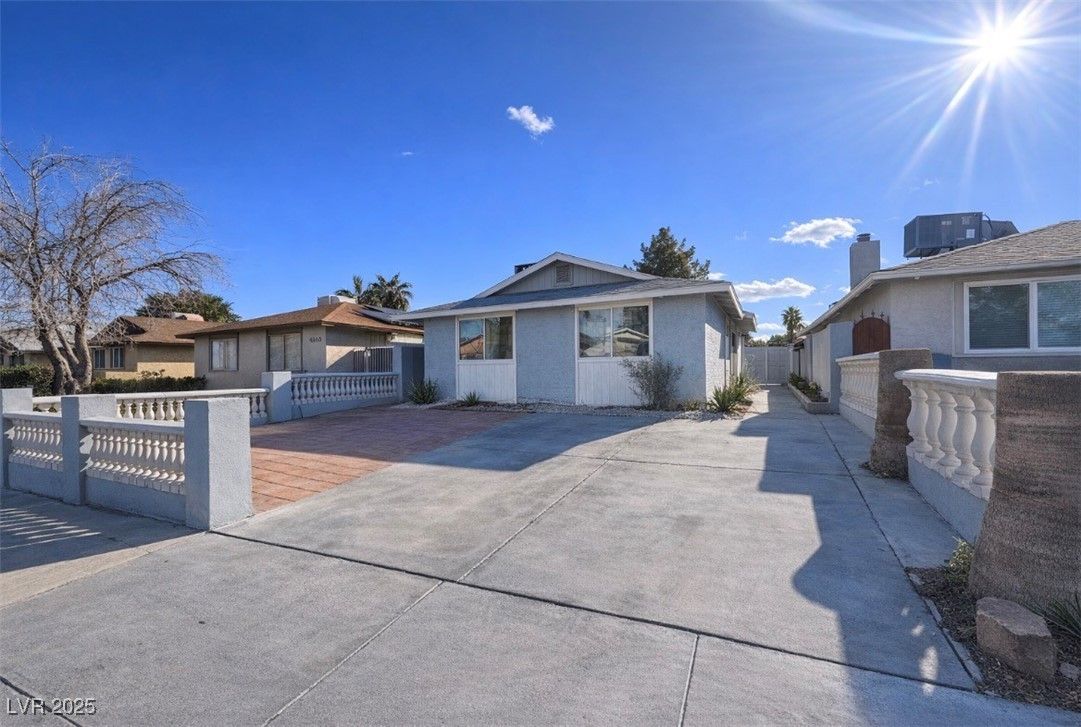
$325,0003 bd2 ba1,378 sqft$236/sqft0.75 mi159 daysSold 2026-08-25
Nearest comparable sales and listings
9 comparables · median price $360,000 · range $318,000 – $382,000 · median $/sq ft $297 · average $/sq ft $286
| Address | Status | Price | $/Sq Ft | Bd / Ba | Sq Ft | Sold / market time | Distance |
|---|---|---|---|---|---|---|---|
| 653 Lineshack Lane | Sold | $343,000 | $313 | 2 / 2 | 1,095 | Sold 2026-04-27 | 0.04 mi |
| 3948 New Hope Way | Sold | $360,000 | $313 | 3 / 2 | 1,152 | Sold 2026-09-09 | 0.10 mi |
| 4136 Tully Avenue | Sold | $355,000 | $249 | 3 / 3 | 1,423 | Sold 2026-06-10 | 0.26 mi |
| 3609 Park Oliver Drive | Sold | $382,000 | $309 | 3 / 2 | 1,236 | Sold 2026-09-02 | 0.35 mi |
| 4021 Lighthouse Avenue | Sold | $318,000 | $297 | 3 / 2 | 1,072 | Sold 2026-10-08 | 0.38 mi |
| 4320 Harris Avenue | Sold | $374,000 | $303 | 3 / 2 | 1,235 | Sold 2026-06-10 | 0.49 mi |
| 4016 Abrams Avenue | Active | $365,000 | $261 | 3 / 3 | 1,400 | 0 days on market | 0.51 mi |
| 3601 Chevy Chase Avenue | Active | $360,001 | $296 | 3 / 2 | 1,218 | 79 days on market | 0.65 mi |
| 4539 Bingham Avenue | Sold | $325,000 | $236 | 3 / 2 | 1,378 | Sold 2026-08-25 | 0.75 mi |


