
Comparable Sales Near 5562 CHAPIN MESA Avenue, Las Vegas, NV 89139
1st Realty · Comparable sales report · 1st.estate · October 21, 2026
Read the Enterprise neighborhood guide →
5562 CHAPIN MESA Avenue, Las Vegas, NV 89139
Status: Sold
$1,830 Sold Price
$1
$ / Sq Ft
1,845
Living Area
3,049 sqft
Lot Size
3
Beds
3
Baths
2006
Year Built
Search Parameters
Property Type
Status
Radius
Sold Within
Beds
Baths
Living Area (Sq Ft)
Lot Size (Sq Ft)
This comp search reflects your current search parameters — adjust the filters above as needed for a more accurate estimate.
Estimated Value
—
Average $/Sqft
—
Check one or more comps below to calculate an estimate.
Nearest 10 of 71 comparable sales and listings within 1 mile of this home. Use the filters above and press Search to refine.
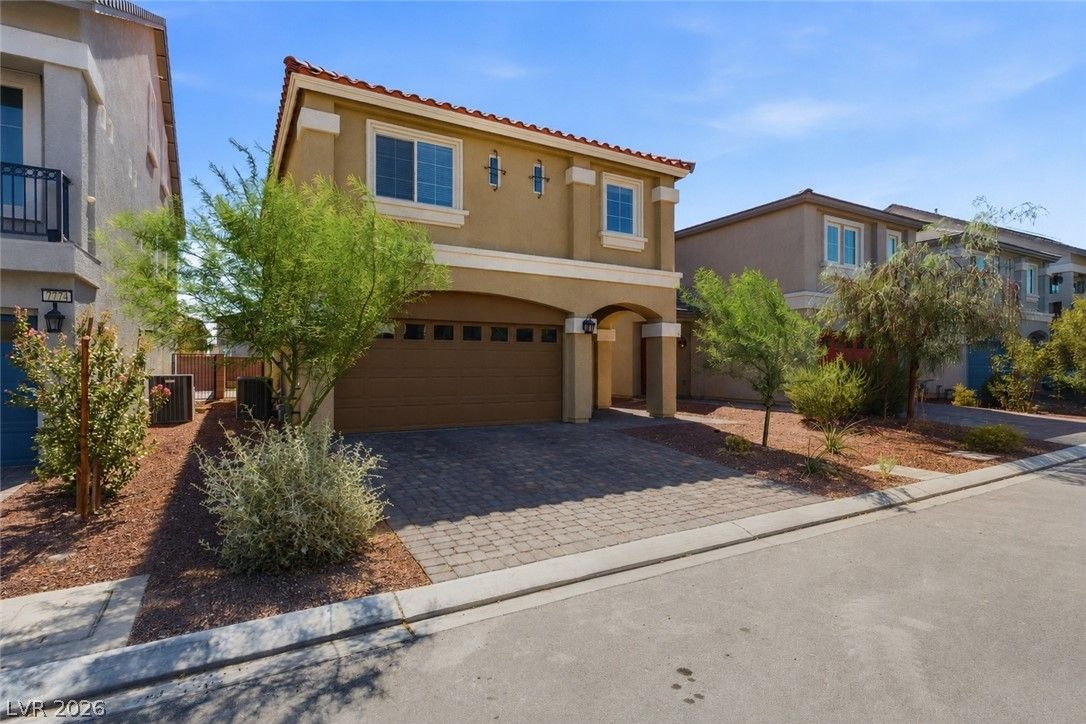
$505,0004 bd3 ba2,161 sqft$234/sqft0.09 mi9 daysSold 2026-07-21
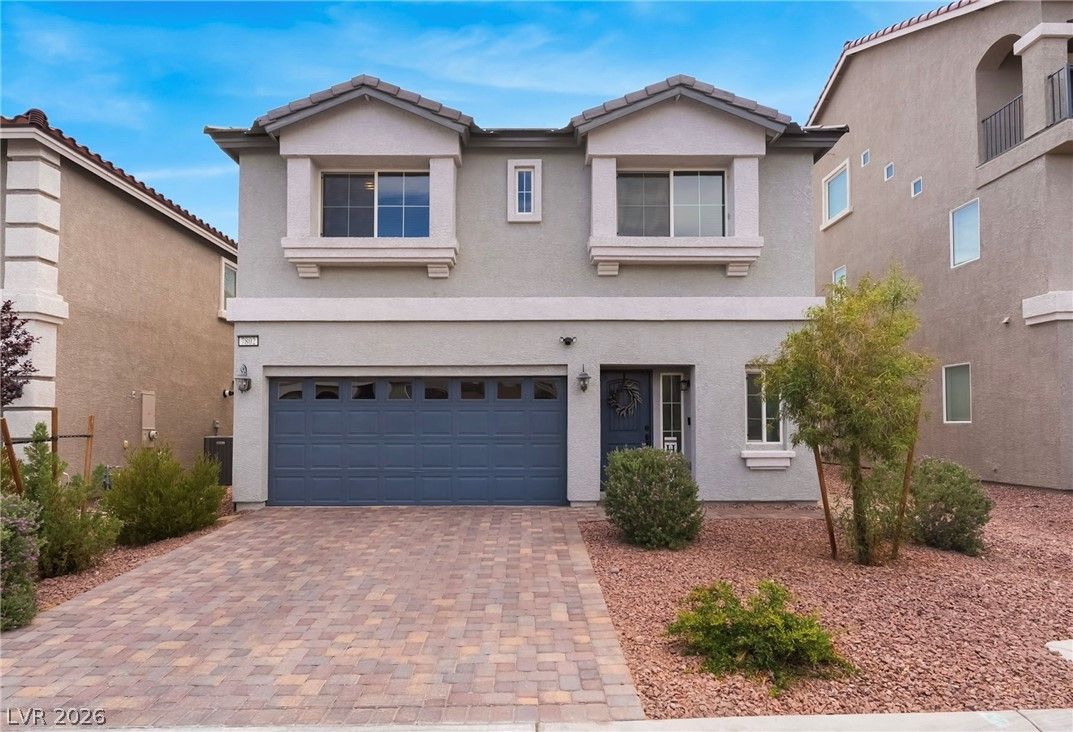
$495,0004 bd3 ba2,290 sqft$216/sqft0.10 mi10 daysSold 2026-09-08
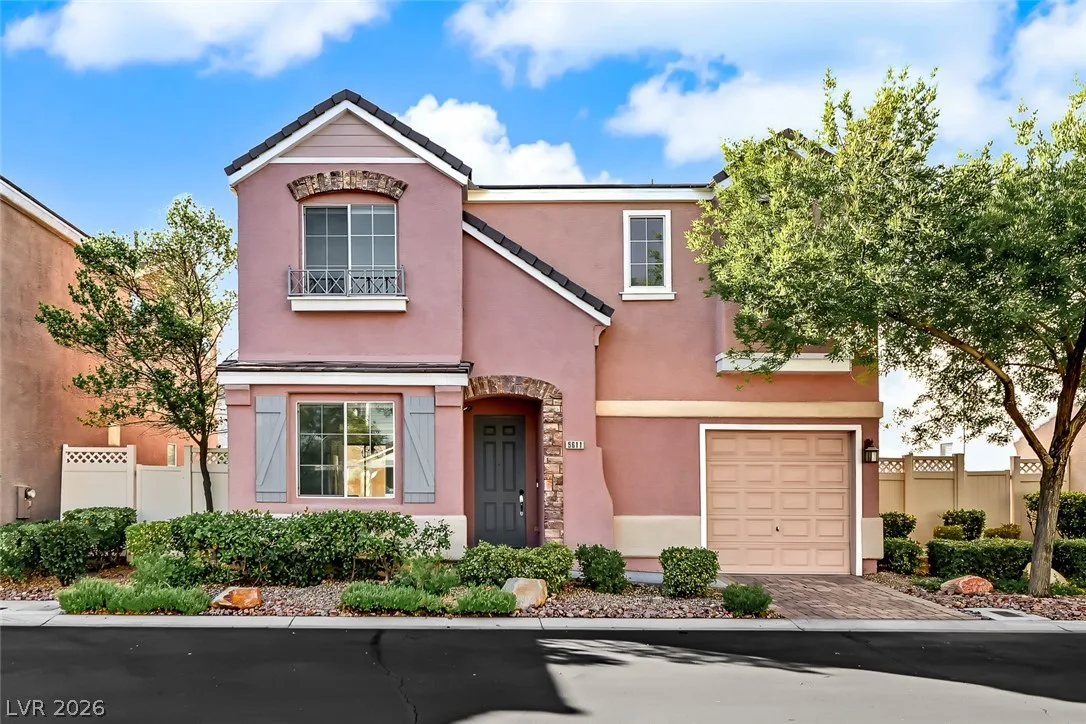
$475,0003 bd3 ba2,033 sqft$234/sqft0.10 mi39 daysSold 2026-09-10
5611 Aurora Crest AvenueActive
$389,9003 bd3 ba1,406 sqft$277/sqft0.15 mi3 days
$510,0004 bd3 ba2,290 sqft$223/sqft0.15 mi7 daysSold 2026-05-22
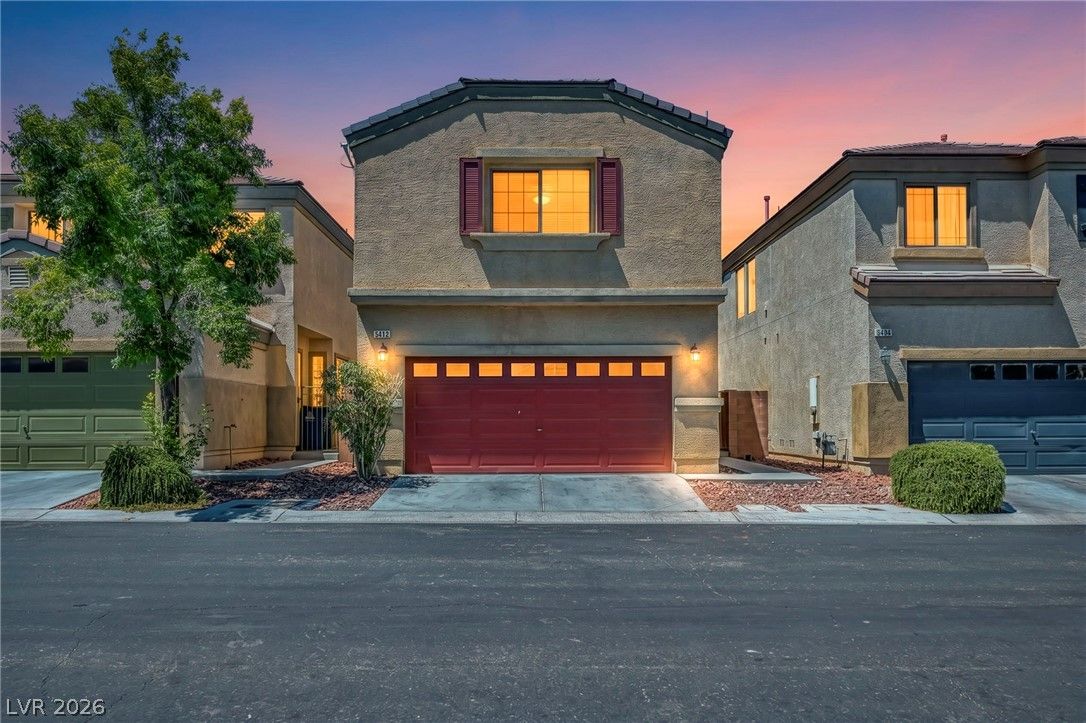
$350,0003 bd3 ba1,493 sqft$234/sqft0.22 mi69 daysSold 2026-09-09
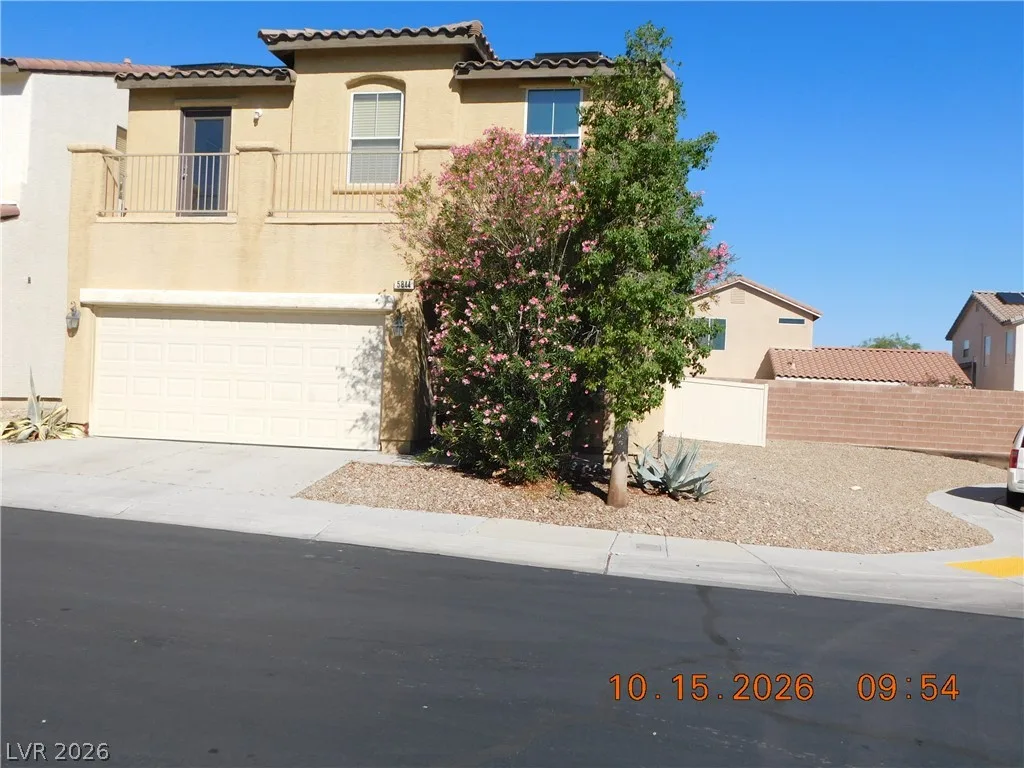
5844 Parrot Cove CourtActive
$415,7504 bd3 ba1,746 sqft$238/sqft0.27 mi2 days
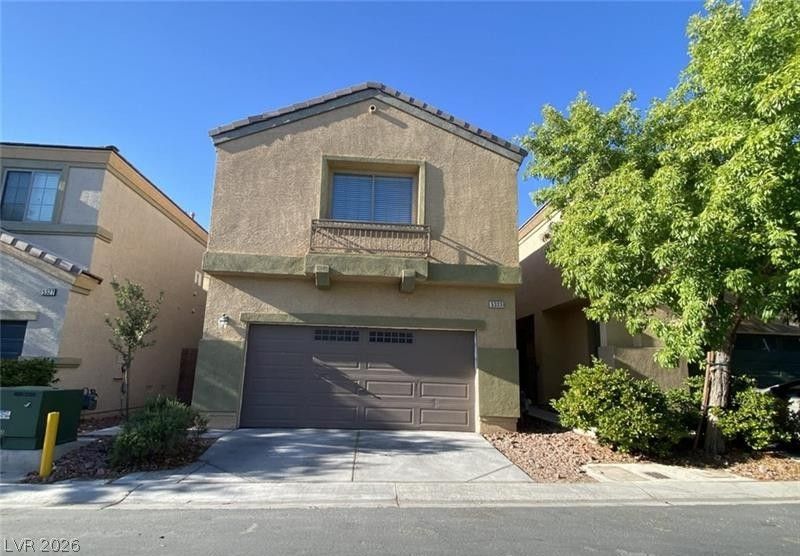
$358,0003 bd3 ba1,492 sqft$240/sqft0.31 mi23 days
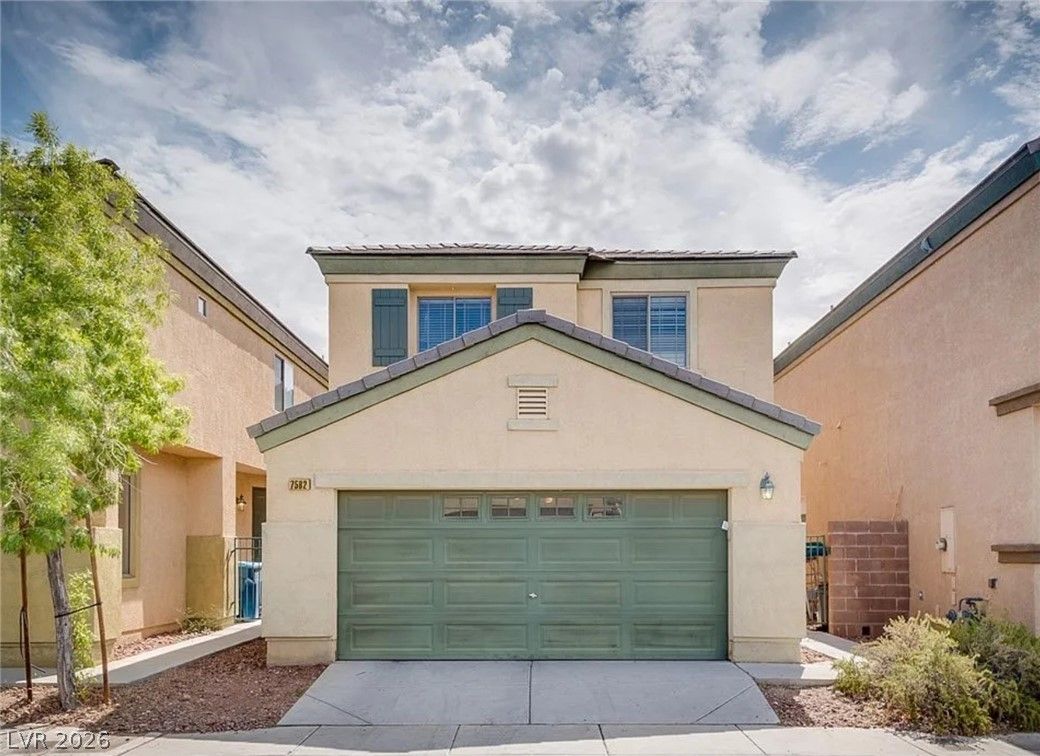
$367,5003 bd3 ba1,557 sqft$236/sqft0.31 mi66 daysSold 2026-09-25
$362,0003 bd3 ba1,492 sqft$243/sqft0.32 mi9 daysSold 2026-05-01
Nearest comparable sales and listings
12 comparables · median price $402,825 · range $350,000 – $510,000 · median $/sq ft $235 · average $/sq ft $236
| Address | Status | Price | $/Sq Ft | Bd / Ba | Sq Ft | Sold / market time | Distance |
|---|---|---|---|---|---|---|---|
| 7786 Tyrell Peaks Street | Sold | $505,000 | $234 | 4 / 3 | 2,161 | Sold 2026-07-21 | 0.09 mi |
| 7780 Tyrell Peaks Street | Sold | $495,000 | $216 | 4 / 3 | 2,290 | Sold 2026-09-08 | 0.10 mi |
| 7802 Pacific Dunes Street | Sold | $475,000 | $234 | 3 / 3 | 2,033 | Sold 2026-09-10 | 0.10 mi |
| 5611 Aurora Crest Avenue | Active | $389,900 | $277 | 3 / 3 | 1,406 | 3 days on market | 0.15 mi |
| 5390 Montauck Avenue | Sold | $510,000 | $223 | 4 / 3 | 2,290 | Sold 2026-05-22 | 0.15 mi |
| 5412 Tinker Toy Avenue | Sold | $350,000 | $234 | 3 / 3 | 1,493 | Sold 2026-09-09 | 0.22 mi |
| 5844 Parrot Cove Court | Active | $415,750 | $238 | 4 / 3 | 1,746 | 2 days on market | 0.27 mi |
| 5333 Floating Flower Avenue | Active | $358,000 | $240 | 3 / 3 | 1,492 | 23 days on market | 0.31 mi |
| 7582 Whiskey Moon | Sold | $367,500 | $236 | 3 / 3 | 1,557 | Sold 2026-09-25 | 0.31 mi |
| 5340 Floating Flower Avenue | Sold | $362,000 | $243 | 3 / 3 | 1,492 | Sold 2026-05-01 | 0.32 mi |
| 7730 Peace Lily Court | Sold | $460,000 | $203 | 3 / 3 | 2,263 | Sold 2026-09-02 | 0.34 mi |
| 5934 Banbury Heights Way | Sold | $369,900 | $251 | 3 / 3 | 1,476 | Sold 2026-05-08 | 0.35 mi |


