
Comparable Sales Near 5716 Palma Del Sol Way, Las Vegas, NV 89130
1st Realty · Comparable sales report · 1st.estate · October 21, 2026
Browse our Las Vegas area guides →
5716 Palma Del Sol Way, Las Vegas, NV 89130
Status: Sold
$2,600 Sold Price
$1
$ / Sq Ft
2,007
Living Area
9,583 sqft
Lot Size
3
Beds
2
Baths
1986
Year Built
Search Parameters
Property Type
Status
Radius
Sold Within
Beds
Baths
Living Area (Sq Ft)
Lot Size (Sq Ft)
This comp search reflects your current search parameters — adjust the filters above as needed for a more accurate estimate.
Estimated Value
—
Average $/Sqft
—
Check one or more comps below to calculate an estimate.
Nearest 10 of 50 comparable sales and listings within 1 mile of this home. Use the filters above and press Search to refine.
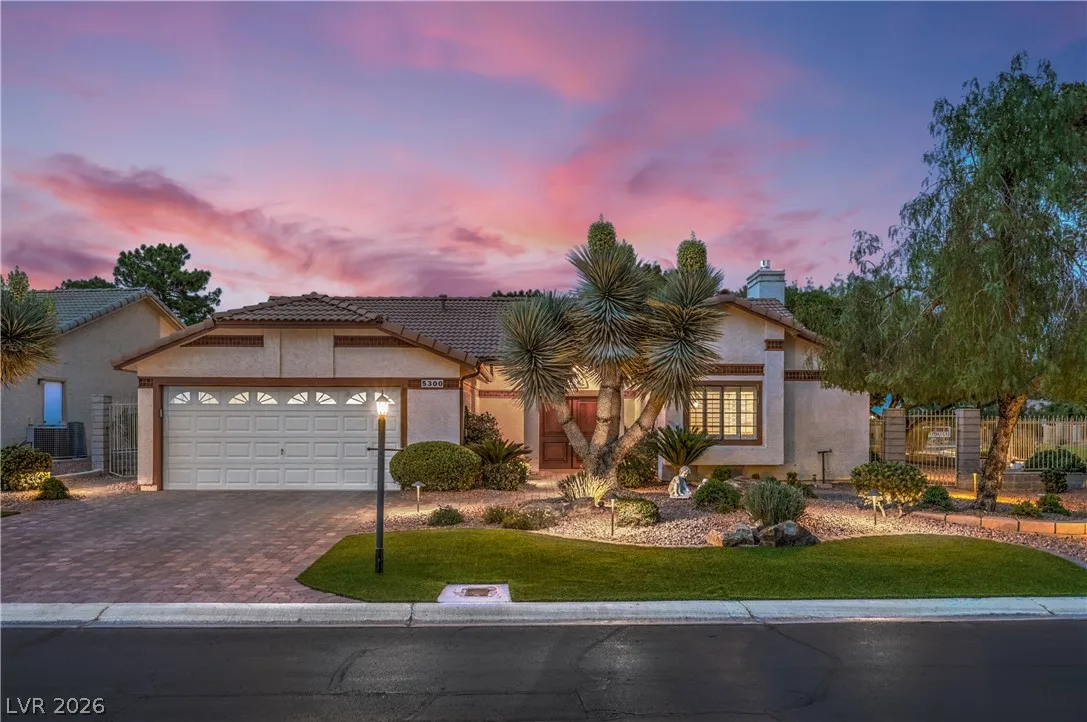
5300 Singing Hills DriveUnder Contract
$479,0002 bd2 ba1,511 sqft$317/sqft0.11 mi5 days
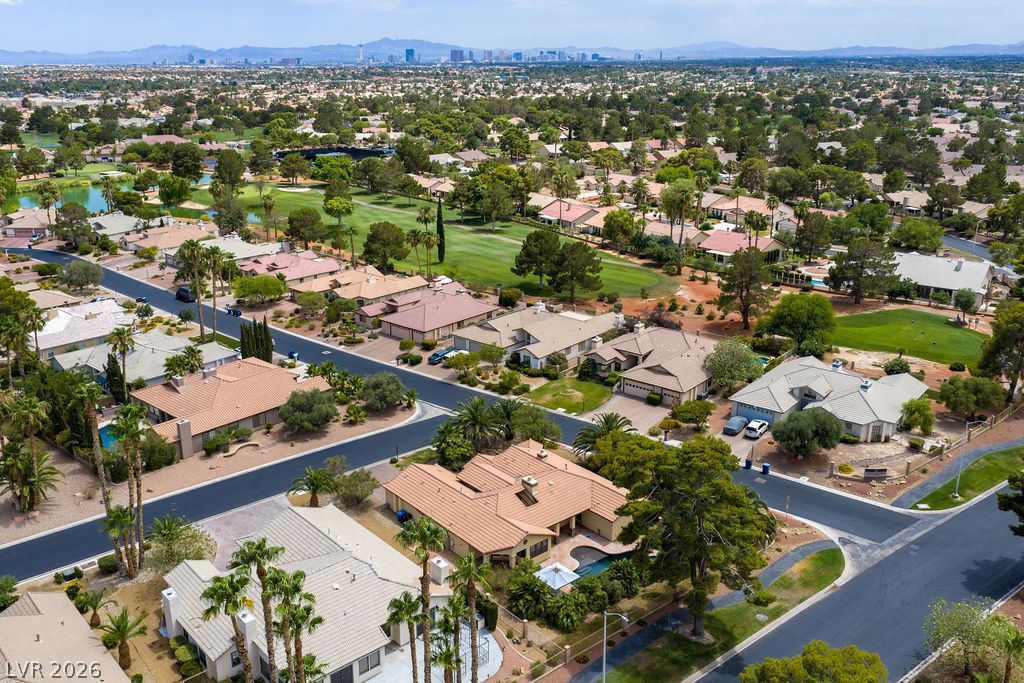
5301 Braemar DriveActive
$549,9003 bd2 ba2,316 sqft$237/sqft0.16 mi90 days
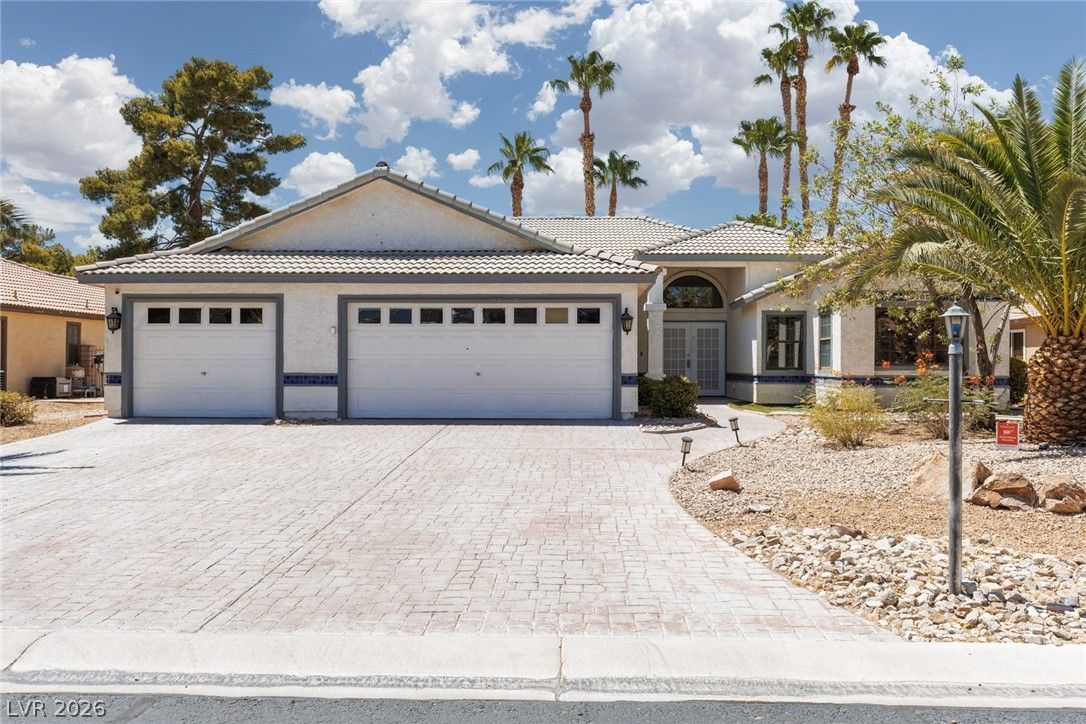
$430,0003 bd3 ba2,496 sqft$172/sqft0.17 mi4 daysSold 2026-08-07
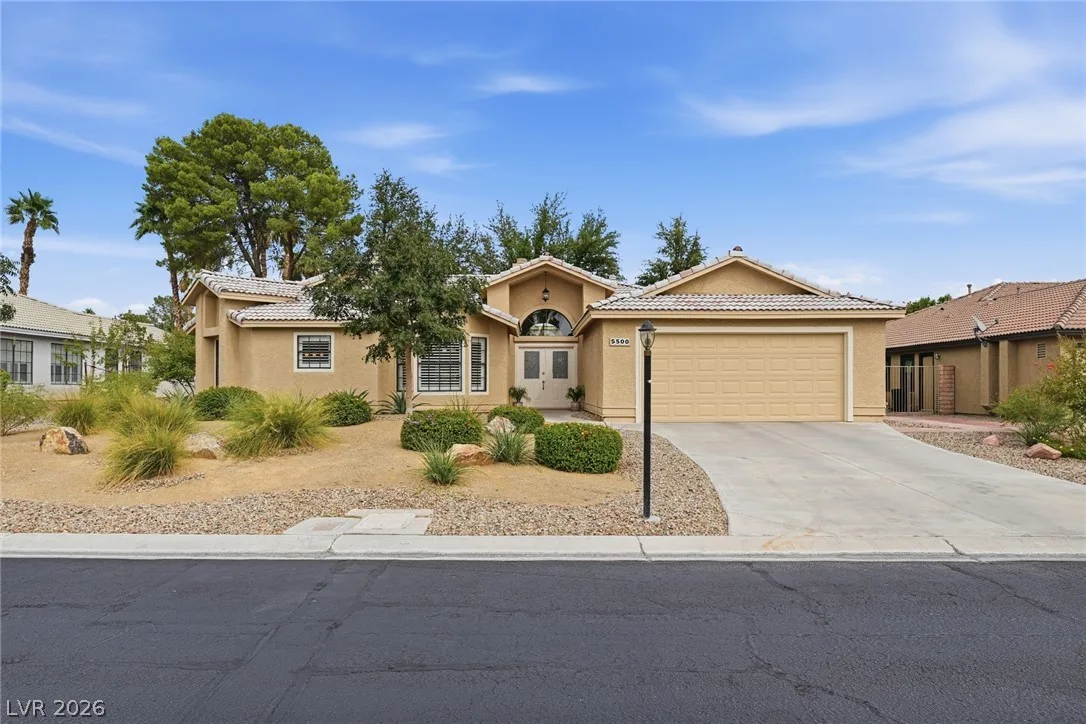
5500 Indian Hills AvenueActive
$728,0003 bd2 ba2,334 sqft$312/sqft0.22 mi1 days
$550,0004 bd3 ba1,837 sqft$299/sqft0.23 mi0 daysSold 2026-06-30
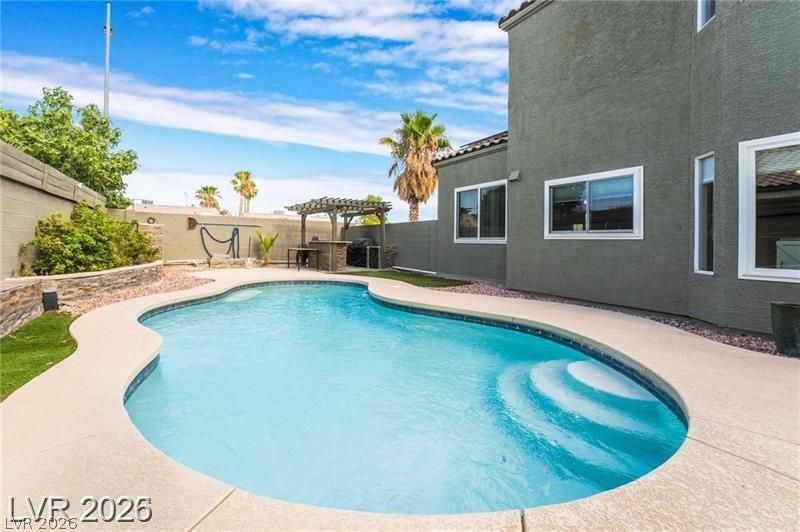
6112 Browning WayActive
$539,9004 bd3 ba1,837 sqft$294/sqft0.25 mi87 days
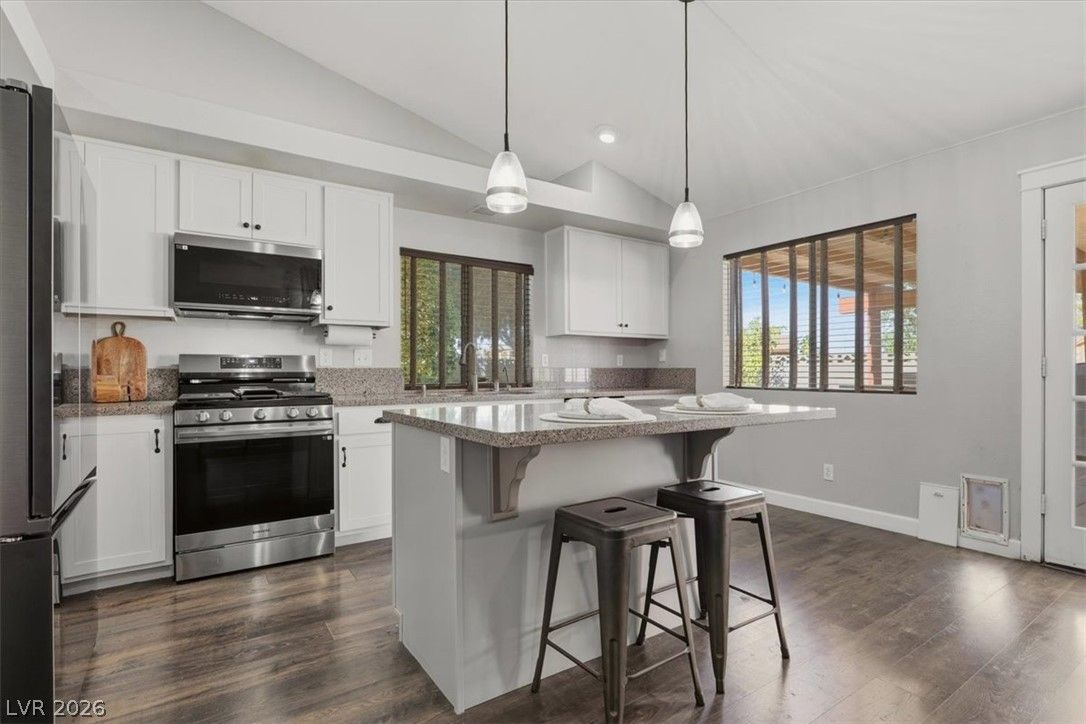
$460,0003 bd2 ba1,784 sqft$258/sqft0.32 mi20 daysSold 2026-09-14
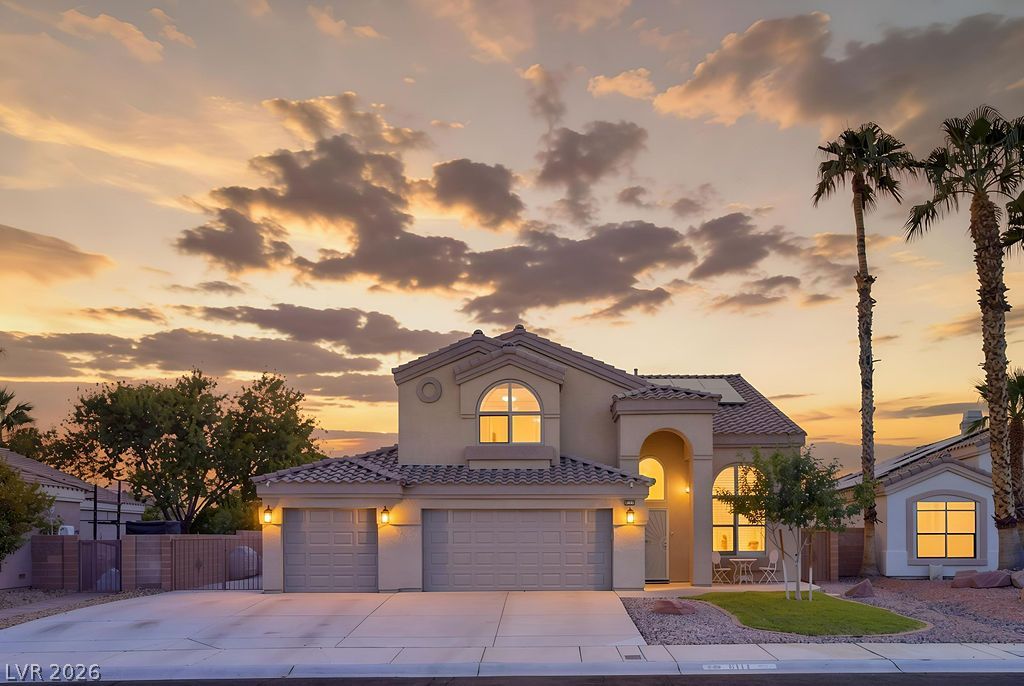
6117 Copper Crest DrivePending
$499,9993 bd3 ba2,026 sqft$247/sqft0.35 mi11 days
$550,0003 bd2 ba2,007 sqft$274/sqft0.35 mi61 daysSold 2026-06-30
$460,0003 bd2 ba2,007 sqft$229/sqft0.37 mi46 daysSold 2026-05-13
Nearest comparable sales and listings
12 comparables · median price $519,950 · range $430,000 – $728,000 · median $/sq ft $266 · average $/sq ft $266
| Address | Status | Price | $/Sq Ft | Bd / Ba | Sq Ft | Sold / market time | Distance |
|---|---|---|---|---|---|---|---|
| 5300 Singing Hills Drive | Under Contract | $479,000 | $317 | 2 / 2 | 1,511 | 5 days on market | 0.11 mi |
| 5301 Braemar Drive | Active | $549,900 | $237 | 3 / 2 | 2,316 | 90 days on market | 0.16 mi |
| 5305 Braemar Drive | Sold | $430,000 | $172 | 3 / 3 | 2,496 | Sold 2026-08-07 | 0.17 mi |
| 5500 Indian Hills Avenue | Active | $728,000 | $312 | 3 / 2 | 2,334 | 1 days on market | 0.22 mi |
| 6100 Fisher Avenue | Sold | $550,000 | $299 | 4 / 3 | 1,837 | Sold 2026-06-30 | 0.23 mi |
| 6112 Browning Way | Active | $539,900 | $294 | 4 / 3 | 1,837 | 87 days on market | 0.25 mi |
| 5528 Rock Creek Lane | Sold | $460,000 | $258 | 3 / 2 | 1,784 | Sold 2026-09-14 | 0.32 mi |
| 6117 Copper Crest Drive | Pending | $499,999 | $247 | 3 / 3 | 2,026 | 11 days on market | 0.35 mi |
| 5548 Singing Hills Drive | Sold | $550,000 | $274 | 3 / 2 | 2,007 | Sold 2026-06-30 | 0.35 mi |
| 5600 Segolilly Circle | Sold | $460,000 | $229 | 3 / 2 | 2,007 | Sold 2026-05-13 | 0.37 mi |
| 5204 Rim View Lane | Sold | $449,000 | $235 | 3 / 3 | 1,907 | Sold 2026-05-11 | 0.40 mi |
| 5020 Pacific Grove Drive | Active | $624,888 | $311 | 3 / 2 | 2,007 | 0 days on market | 0.43 mi |


