
Comparable Sales Near 5835 Running Horse Drive, North Las Vegas, NV 89081
1st Realty · Comparable sales report · 1st.estate · October 21, 2026
Read the North Las Vegas area guide →
5835 Running Horse Drive, North Las Vegas, NV 89081
Status: Sold
$440,000 Sold Price
$159
$ / Sq Ft
2,761
Living Area
6,098 sqft
Lot Size
4
Beds
3
Baths
2004
Year Built
Search Parameters
Property Type
Status
Radius
Sold Within
Beds
Baths
Living Area (Sq Ft)
Lot Size (Sq Ft)
This comp search reflects your current search parameters — adjust the filters above as needed for a more accurate estimate.
Estimated Value
—
Average $/Sqft
—
Check one or more comps below to calculate an estimate.
Nearest 10 of 41 comparable sales and listings within 1 mile of this home. Use the filters above and press Search to refine.
$457,0005 bd3 ba2,480 sqft$184/sqft0.15 mi8 daysSold 2026-04-27

6020 Gum Springs StreetActive
$422,0003 bd3 ba2,344 sqft$180/sqft0.25 mi33 days
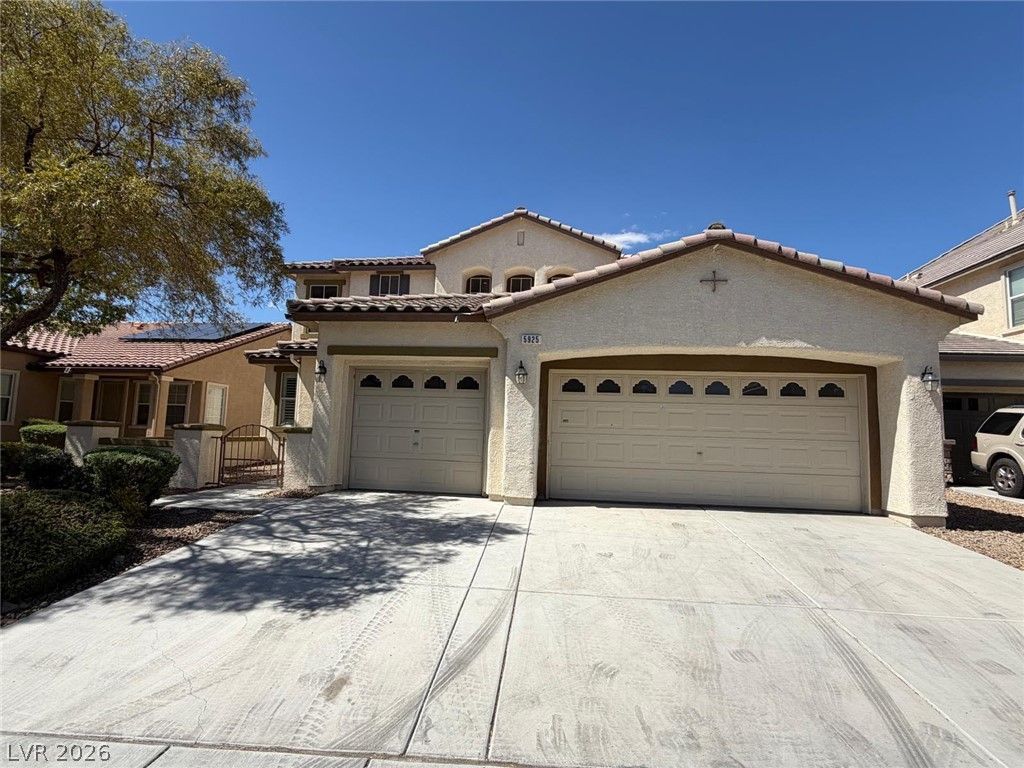
$509,0004 bd3 ba3,376 sqft$151/sqft0.27 mi15 days
$499,9995 bd4 ba3,097 sqft$161/sqft0.27 mi3 daysSold 2026-05-29
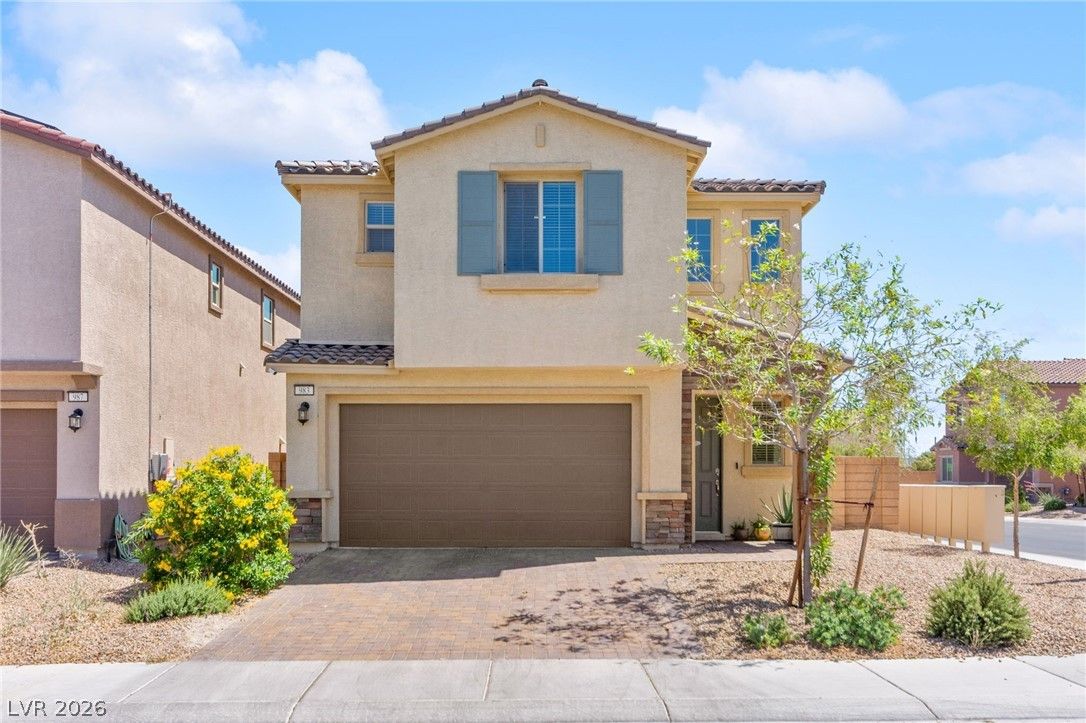
$470,0004 bd3 ba2,270 sqft$207/sqft0.27 mi34 daysSold 2026-08-07
$500,0004 bd3 ba3,009 sqft$166/sqft0.28 mi71 daysSold 2026-06-02
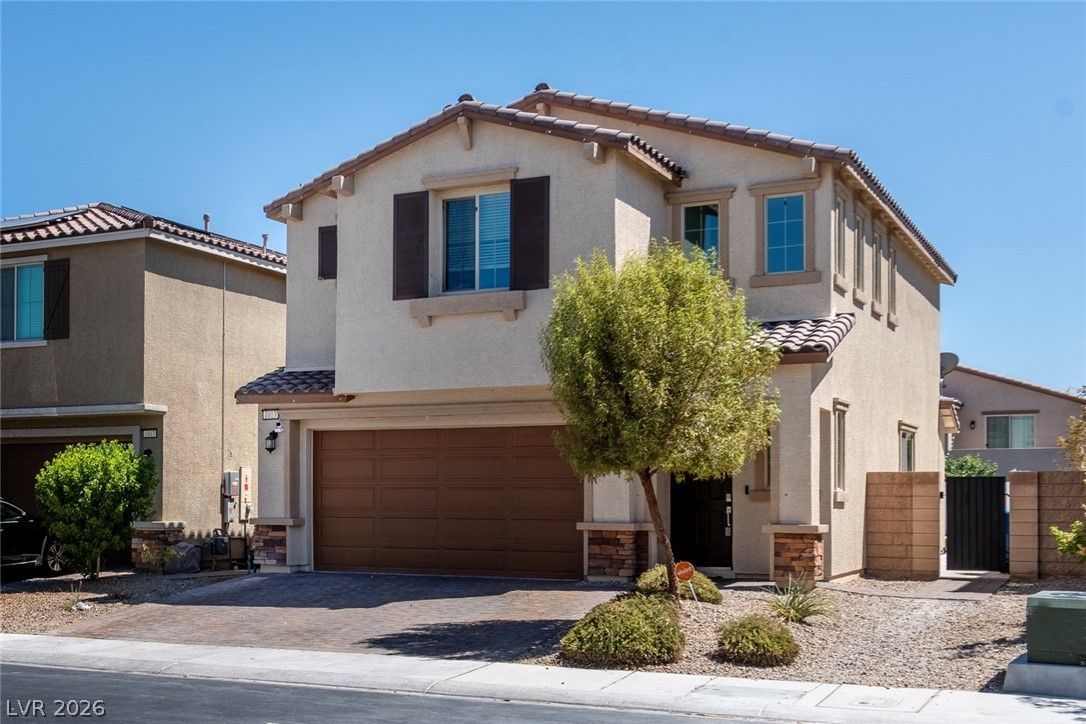
1013 Cliff Castle AvenueActive
$525,0004 bd3 ba2,270 sqft$231/sqft0.30 mi8 days
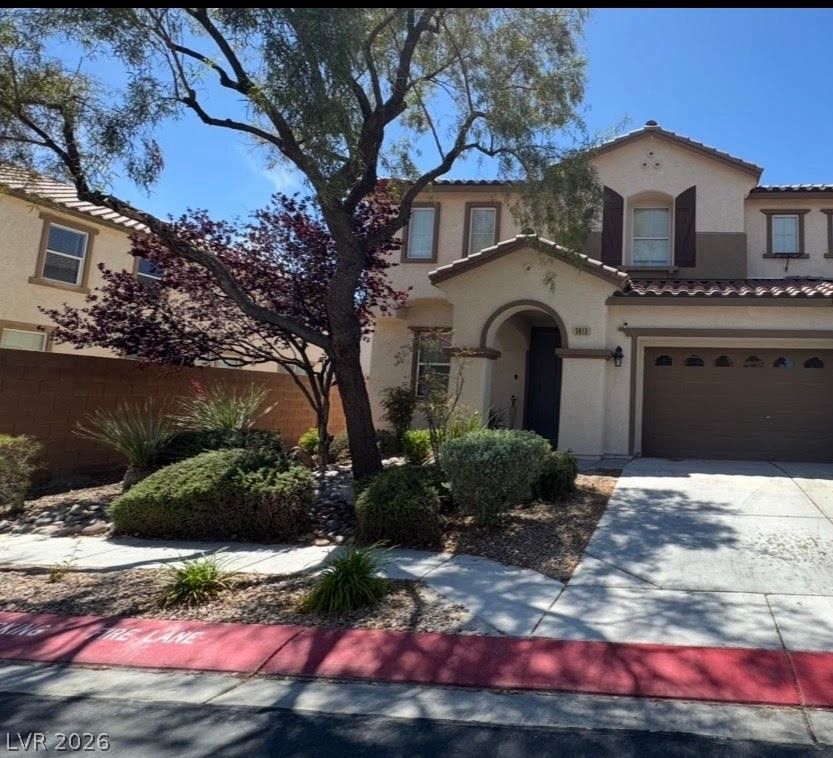
5913 Caddy Ridge StreetActive
$549,9004 bd3 ba2,825 sqft$195/sqft0.31 mi22 days
$555,0005 bd4 ba3,097 sqft$179/sqft0.31 mi72 daysSold 2026-07-21
$515,0004 bd3 ba2,703 sqft$191/sqft0.32 mi5 daysSold 2026-05-26
Nearest comparable sales and listings
12 comparables · median price $504,500 · range $420,000 – $625,000 · median $/sq ft $182 · average $/sq ft $187
| Address | Status | Price | $/Sq Ft | Bd / Ba | Sq Ft | Sold / market time | Distance |
|---|---|---|---|---|---|---|---|
| 1008 East El Campo Grande Avenue | Sold | $457,000 | $184 | 5 / 3 | 2,480 | Sold 2026-04-27 | 0.15 mi |
| 6020 Gum Springs Street | Active | $422,000 | $180 | 3 / 3 | 2,344 | 33 days on market | 0.25 mi |
| 5925 Big Horn View Street | Active | $509,000 | $151 | 4 / 3 | 3,376 | 15 days on market | 0.27 mi |
| 6030 Arbor Crest Street | Sold | $499,999 | $161 | 5 / 4 | 3,097 | Sold 2026-05-29 | 0.27 mi |
| 983 Cliff Castle Avenue | Sold | $470,000 | $207 | 4 / 3 | 2,270 | Sold 2026-08-07 | 0.27 mi |
| 6020 Old Vines Street | Sold | $500,000 | $166 | 4 / 3 | 3,009 | Sold 2026-06-02 | 0.28 mi |
| 1013 Cliff Castle Avenue | Active | $525,000 | $231 | 4 / 3 | 2,270 | 8 days on market | 0.30 mi |
| 5913 Caddy Ridge Street | Active | $549,900 | $195 | 4 / 3 | 2,825 | 22 days on market | 0.31 mi |
| 1008 Robust Avenue | Sold | $555,000 | $179 | 5 / 4 | 3,097 | Sold 2026-07-21 | 0.31 mi |
| 1001 Junipine Avenue | Sold | $515,000 | $191 | 4 / 3 | 2,703 | Sold 2026-05-26 | 0.32 mi |
| 5924 Vista Creek Street | Active | $625,000 | $221 | 4 / 3 | 2,825 | 5 days on market | 0.33 mi |
| 6024 Peacock Pine Street | Sold | $420,000 | $176 | 4 / 3 | 2,386 | Sold 2026-05-22 | 0.34 mi |


