
Comparable Sales Near 2637 Island Brook Drive, Las Vegas, NV 89108
1st Realty · Comparable sales report · 1st.estate · October 21, 2026
Browse our Las Vegas area guides →
2637 Island Brook Drive, Las Vegas, NV 89108
Status: Sold
$1,800 Sold Price
$1
$ / Sq Ft
1,836
Living Area
4,792 sqft
Lot Size
3
Beds
3
Baths
1990
Year Built
Search Parameters
Property Type
Status
Radius
Sold Within
Beds
Baths
Living Area (Sq Ft)
Lot Size (Sq Ft)
This comp search reflects your current search parameters — adjust the filters above as needed for a more accurate estimate.
Estimated Value
—
Average $/Sqft
—
Check one or more comps below to calculate an estimate.
Nearest 10 of 14 comparable sales and listings within 1 mile of this home. Use the filters above and press Search to refine.
$410,0004 bd3 ba1,763 sqft$233/sqft0.06 mi6 daysSold 2026-06-30
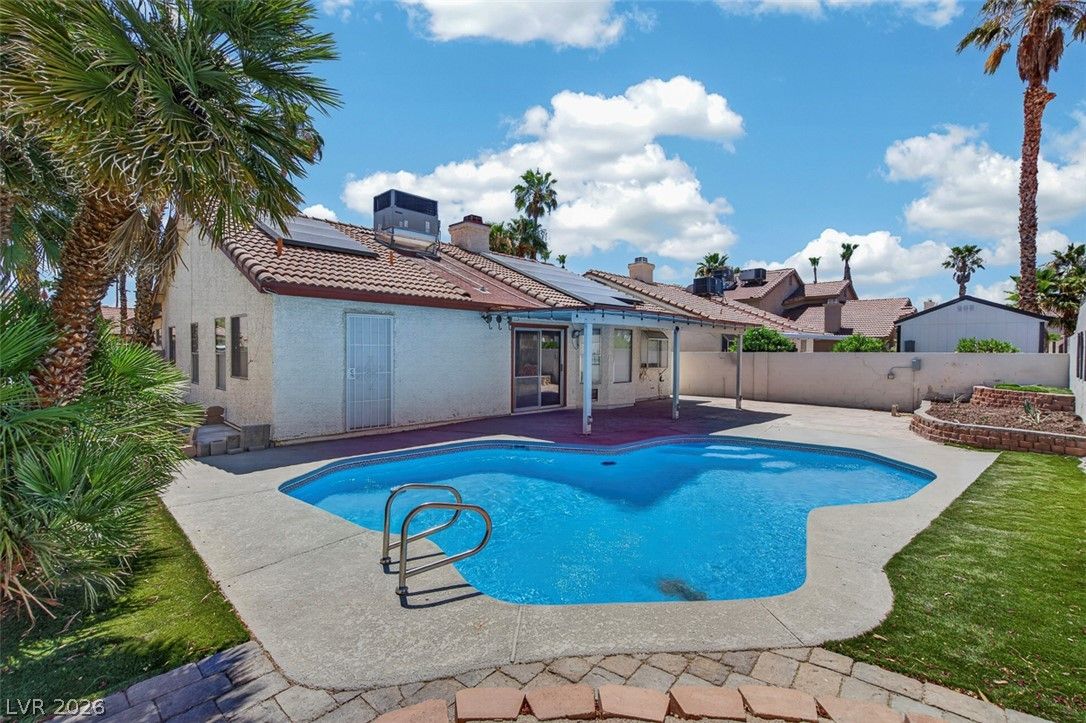
2609 Shakespeare RoadActive
$420,0003 bd2 ba1,622 sqft$259/sqft0.07 mi69 days
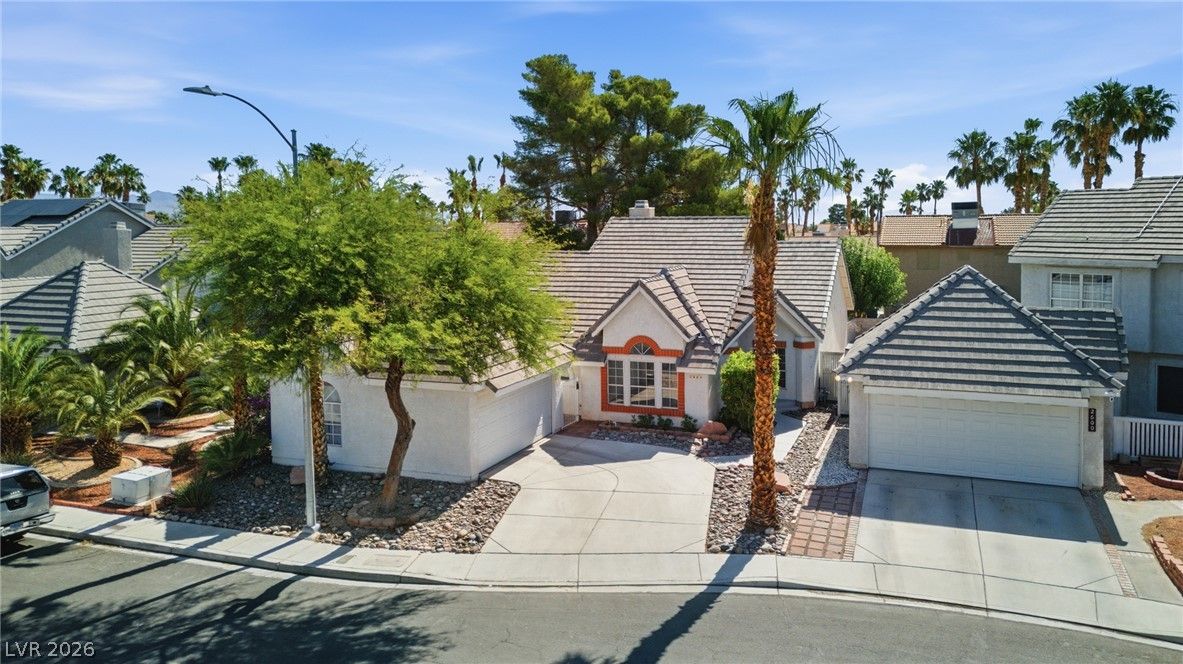
$402,5003 bd2 ba1,687 sqft$239/sqft0.07 mi25 daysSold 2026-08-03

2764 TROTWOOD LaneActive
$469,9003 bd3 ba1,601 sqft$294/sqft0.10 mi0 days
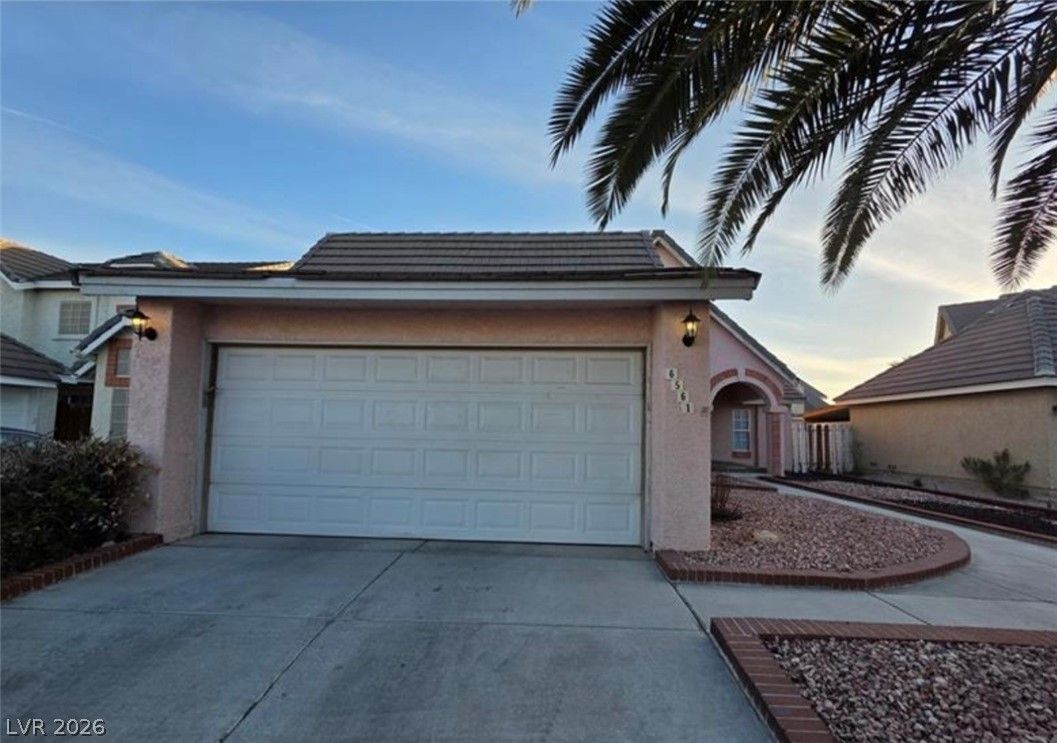
6561 Avon CourtActive
$454,9004 bd3 ba1,974 sqft$230/sqft0.11 mi22 days
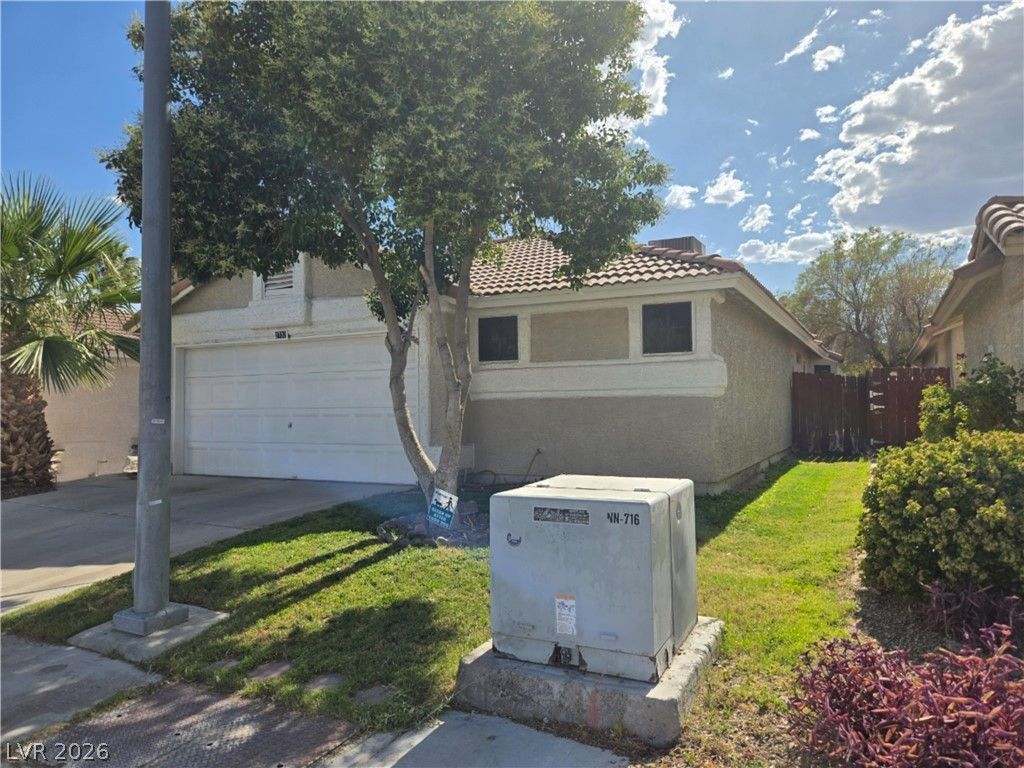
2733 Ironside DriveActive
$300,0003 bd2 ba1,440 sqft$208/sqft0.12 mi64 days
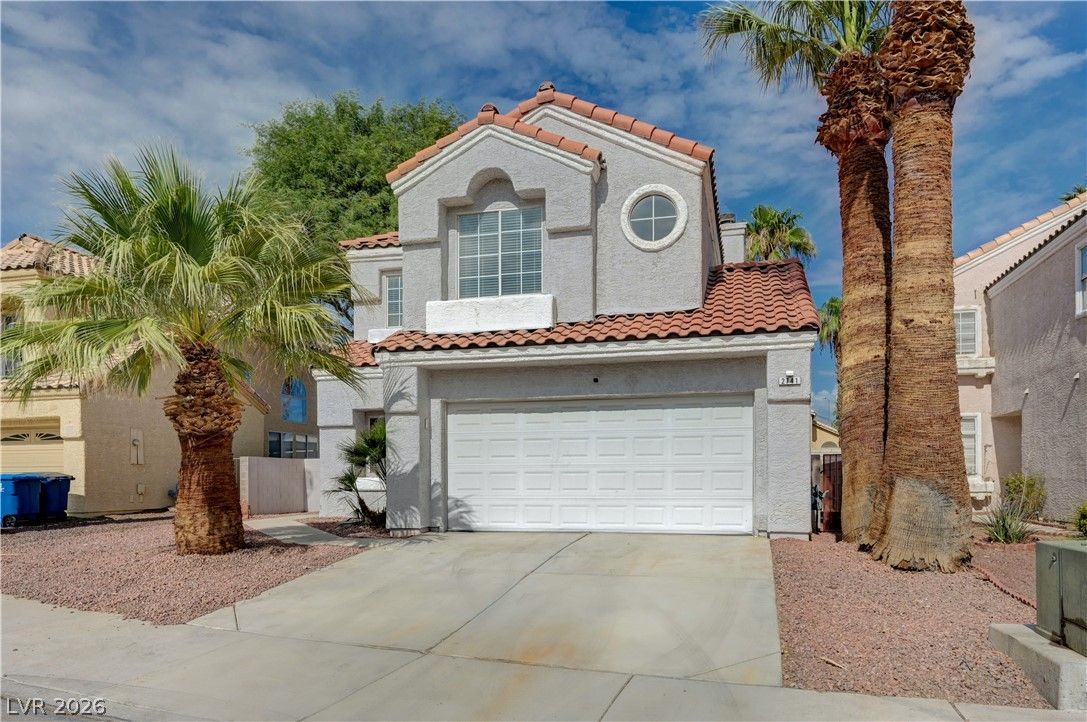
$405,0003 bd3 ba1,601 sqft$253/sqft0.14 mi18 daysSold 2026-09-04
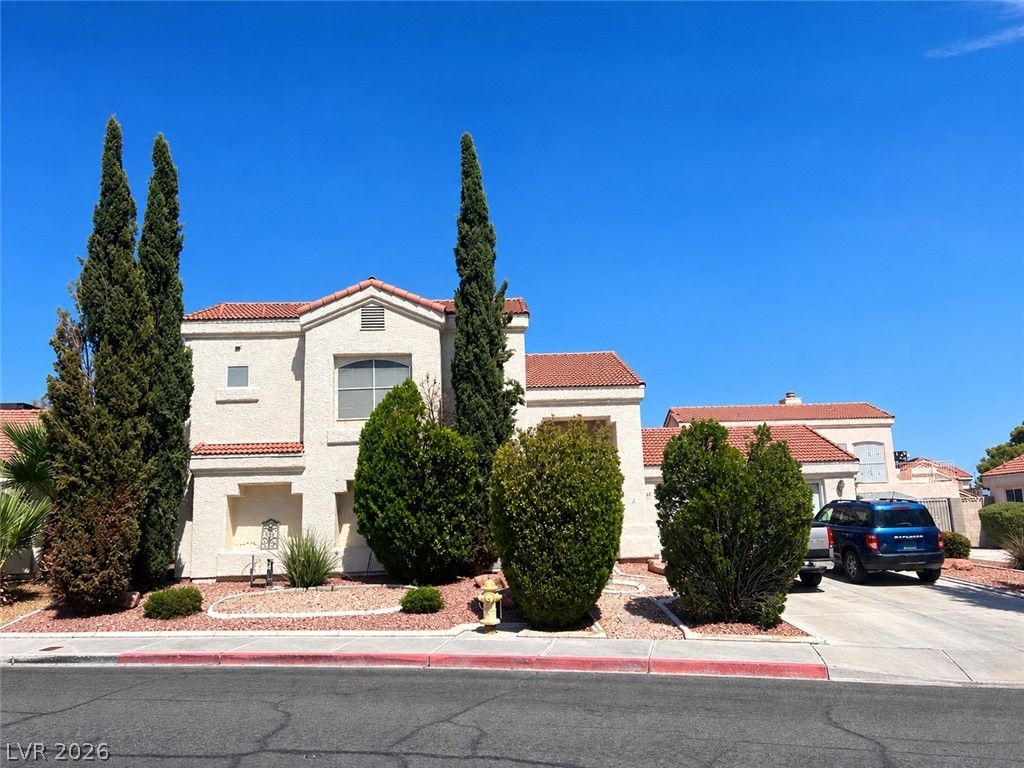
6616 Sterling Springs ParkwayUnder Contract
$360,0003 bd3 ba1,472 sqft$245/sqft0.39 mi11 days

6664 Goldencreek WayActive
$375,0003 bd3 ba1,887 sqft$199/sqft0.40 mi0 days
$405,0003 bd3 ba1,702 sqft$238/sqft0.44 mi27 daysSold 2026-04-24
Nearest comparable sales and listings
12 comparables · median price $405,000 · range $300,000 – $469,900 · median $/sq ft $238 · average $/sq ft $242
| Address | Status | Price | $/Sq Ft | Bd / Ba | Sq Ft | Sold / market time | Distance |
|---|---|---|---|---|---|---|---|
| 2701 Riley Oaks Court | Sold | $410,000 | $233 | 4 / 3 | 1,763 | Sold 2026-06-30 | 0.06 mi |
| 2609 Shakespeare Road | Active | $420,000 | $259 | 3 / 2 | 1,622 | 69 days on market | 0.07 mi |
| 2604 Cathedral Lane | Sold | $402,500 | $239 | 3 / 2 | 1,687 | Sold 2026-08-03 | 0.07 mi |
| 2764 TROTWOOD Lane | Active | $469,900 | $294 | 3 / 3 | 1,601 | 0 days on market | 0.10 mi |
| 6561 Avon Court | Active | $454,900 | $230 | 4 / 3 | 1,974 | 22 days on market | 0.11 mi |
| 2733 Ironside Drive | Active | $300,000 | $208 | 3 / 2 | 1,440 | 64 days on market | 0.12 mi |
| 2741 Trotwood Lane | Sold | $405,000 | $253 | 3 / 3 | 1,601 | Sold 2026-09-04 | 0.14 mi |
| 6616 Sterling Springs Parkway | Under Contract | $360,000 | $245 | 3 / 3 | 1,472 | 11 days on market | 0.39 mi |
| 6664 Goldencreek Way | Active | $375,000 | $199 | 3 / 3 | 1,887 | 0 days on market | 0.40 mi |
| 2340 Steinke Lane | Sold | $405,000 | $238 | 3 / 3 | 1,702 | Sold 2026-04-24 | 0.44 mi |
| 6673 Silver Penny Avenue | Active | $459,999 | $227 | 4 / 3 | 2,028 | 292 days on market | 0.51 mi |
| 2323 El Cerrito Circle | Sold | $390,000 | $277 | 3 / 2 | 1,410 | Sold 2026-06-22 | 0.51 mi |


