
Comparable Sales Near 1045 Smiths Island Avenue, North Las Vegas, NV 89084
1st Realty · Comparable sales report · 1st.estate · October 20, 2026
Read the North Las Vegas area guide →
1045 Smiths Island Avenue, North Las Vegas, NV 89084
Status: Sold
$445,000 Sold Price
$278
$ / Sq Ft
1,600
Living Area
3,485 sqft
Lot Size
3
Beds
3
Baths
2025
Year Built
Search Parameters
Property Type
Status
Radius
Sold Within
Beds
Baths
Living Area (Sq Ft)
Lot Size (Sq Ft)
This comp search reflects your current search parameters — adjust the filters above as needed for a more accurate estimate.
Estimated Value
—
Average $/Sqft
—
Check one or more comps below to calculate an estimate.
Nearest 10 of 58 comparable sales and listings within 1 mile of this home. Use the filters above and press Search to refine.
$475,0003 bd3 ba1,795 sqft$265/sqft0.07 mi13 daysSold 2026-06-11
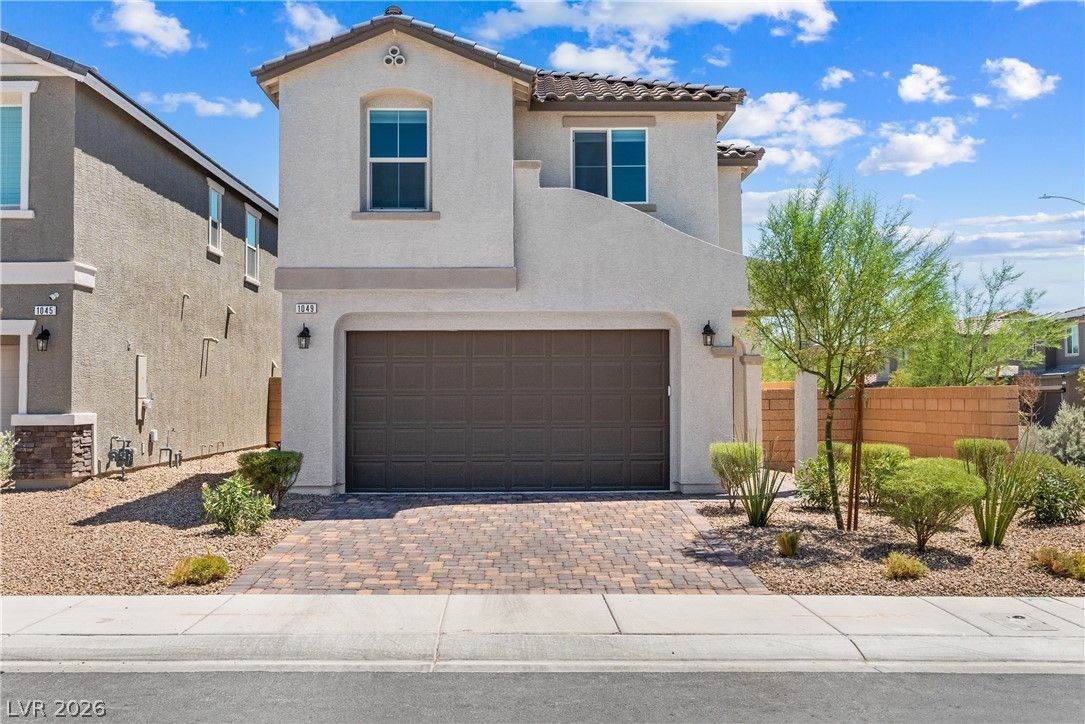
1049 Williamtown AvenueActive
$445,0003 bd3 ba1,763 sqft$252/sqft0.09 mi86 days
$432,0003 bd3 ba1,678 sqft$257/sqft0.11 mi33 daysSold 2026-04-28
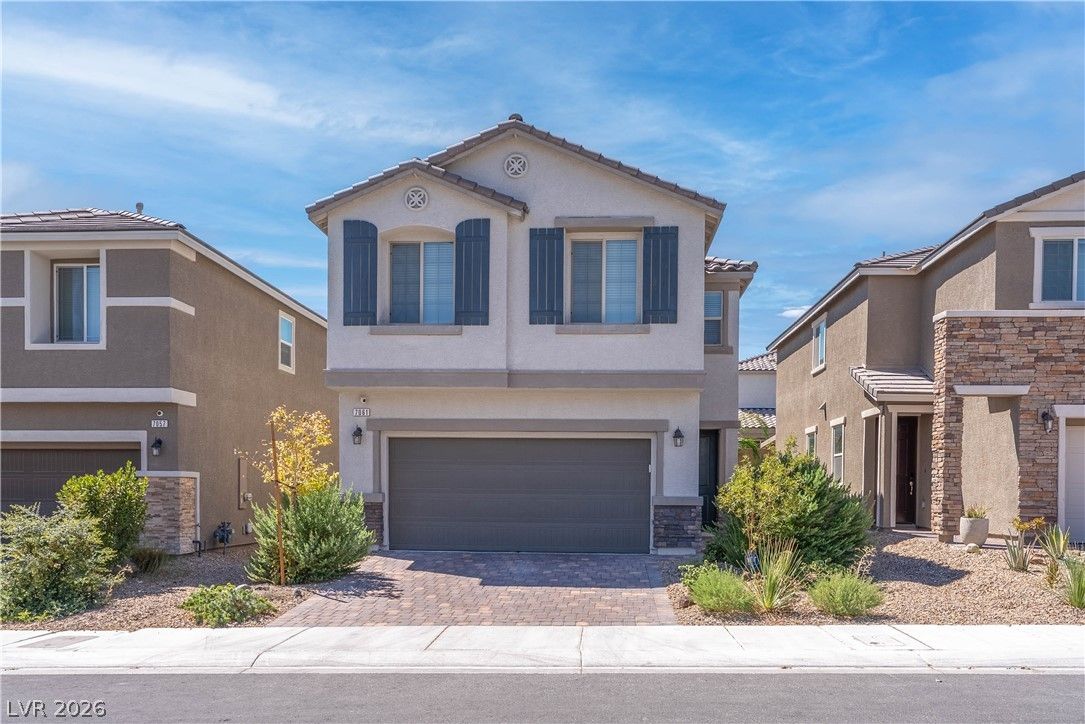
7061 Tilligerry StreetActive
$479,9993 bd3 ba1,795 sqft$267/sqft0.17 mi9 days
$450,0003 bd3 ba1,858 sqft$242/sqft0.20 mi84 daysSold 2026-05-18
$459,9503 bd3 ba1,800 sqft$256/sqft0.22 mi132 daysSold 2026-05-01
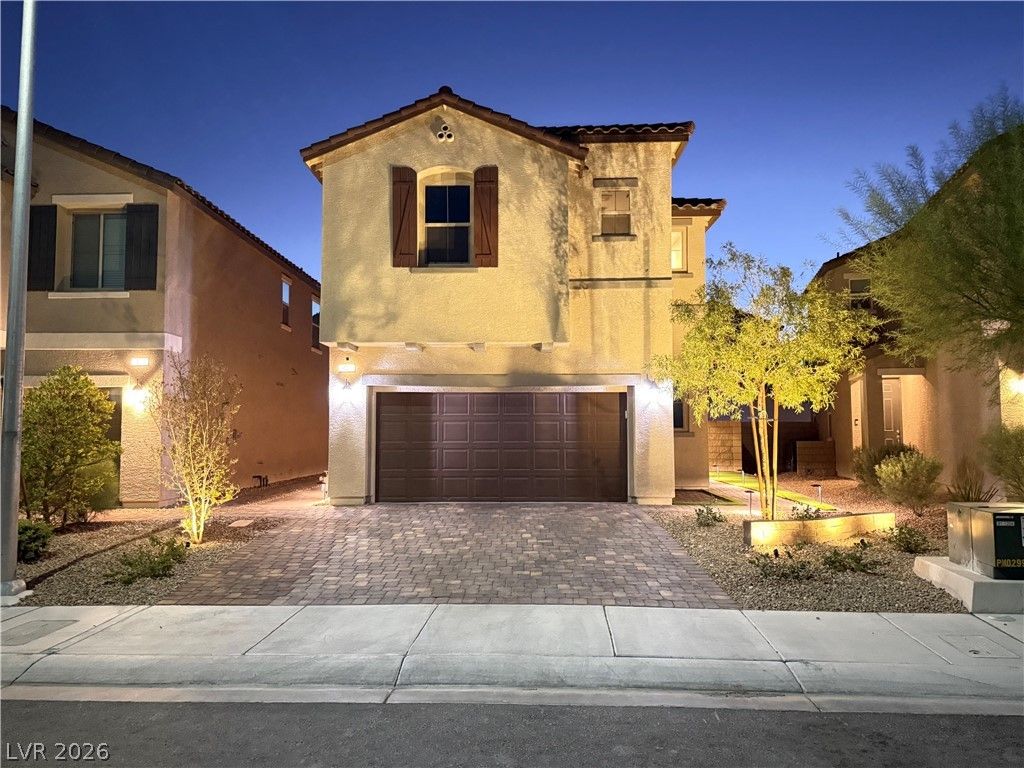
7029 Tilligerry StreetActive
$469,5004 bd3 ba1,858 sqft$253/sqft0.23 mi164 days
$519,9503 bd3 ba1,858 sqft$280/sqft0.23 mi69 daysSold 2026-05-29
$441,9903 bd3 ba1,715 sqft$258/sqft0.38 mi5 daysSold 2026-04-30
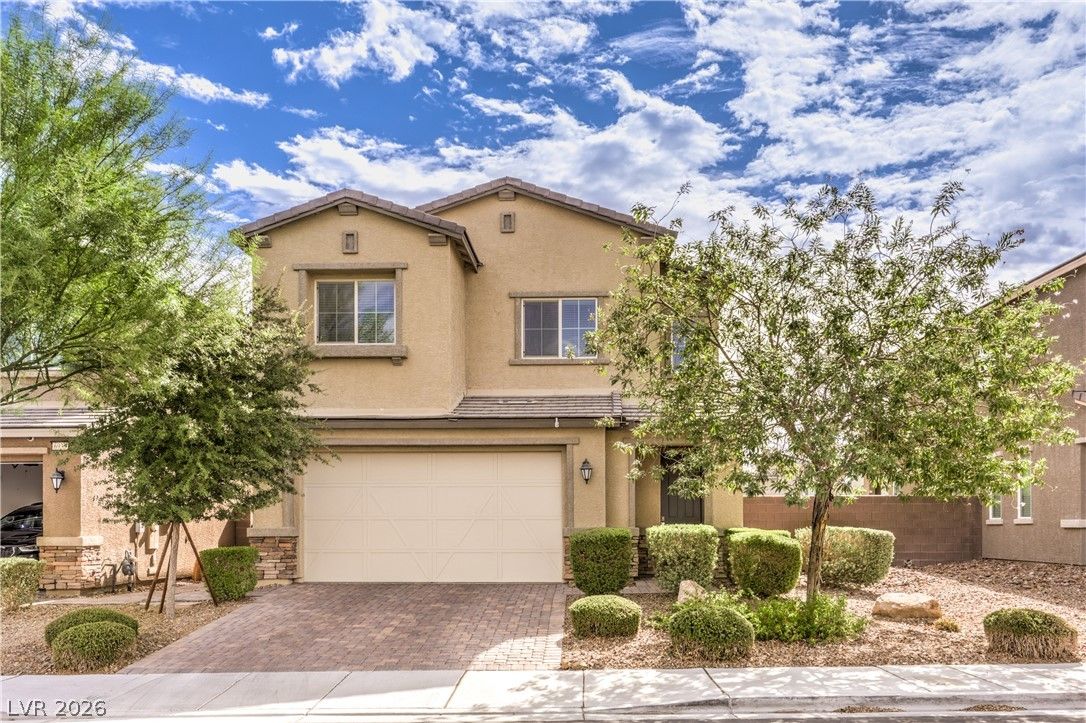
6934 Denio Island StreetActive
$455,0003 bd3 ba1,956 sqft$233/sqft0.43 mi19 days
Nearest comparable sales and listings
12 comparables · median price $457,475 · range $432,000 – $519,950 · median $/sq ft $254 · average $/sq ft $254
| Address | Status | Price | $/Sq Ft | Bd / Ba | Sq Ft | Sold / market time | Distance |
|---|---|---|---|---|---|---|---|
| 1038 WILLIAMTOWN Avenue | Sold | $475,000 | $265 | 3 / 3 | 1,795 | Sold 2026-06-11 | 0.07 mi |
| 1049 Williamtown Avenue | Active | $445,000 | $252 | 3 / 3 | 1,763 | 86 days on market | 0.09 mi |
| 1222 Corral Bluffs Avenue | Sold | $432,000 | $257 | 3 / 3 | 1,678 | Sold 2026-04-28 | 0.11 mi |
| 7061 Tilligerry Street | Active | $479,999 | $267 | 3 / 3 | 1,795 | 9 days on market | 0.17 mi |
| 7045 Tilligerry Street | Sold | $450,000 | $242 | 3 / 3 | 1,858 | Sold 2026-05-18 | 0.20 mi |
| 7060 Port Stephens Street | Sold | $459,950 | $256 | 3 / 3 | 1,800 | Sold 2026-05-01 | 0.22 mi |
| 7029 Tilligerry Street | Active | $469,500 | $253 | 4 / 3 | 1,858 | 164 days on market | 0.23 mi |
| 938 Hunter Shores Avenue | Sold | $519,950 | $280 | 3 / 3 | 1,858 | Sold 2026-05-29 | 0.23 mi |
| 941 Brandon Lake Avenue | Sold | $441,990 | $258 | 3 / 3 | 1,715 | Sold 2026-04-30 | 0.38 mi |
| 6934 Denio Island Street | Active | $455,000 | $233 | 3 / 3 | 1,956 | 19 days on market | 0.43 mi |
| 925 Galloway Lake Avenue | Sold | $469,990 | $251 | 4 / 3 | 1,872 | Sold 2026-09-21 | 0.43 mi |
| 6930 Denio Island Street | Sold | $433,000 | $229 | 4 / 3 | 1,893 | Sold 2026-05-22 | 0.44 mi |


