
Comparable Sales Near 5139 Sandstone Drive, Las Vegas, NV 89142
1st Realty · Comparable sales report · 1st.estate · October 20, 2026
Browse our Las Vegas area guides →
5139 Sandstone Drive, Las Vegas, NV 89142
Status: Sold
$1,700 Sold Price
$2
$ / Sq Ft
1,052
Living Area
3,920 sqft
Lot Size
2
Beds
2
Baths
1991
Year Built
Search Parameters
Property Type
Status
Radius
Sold Within
Beds
Baths
Living Area (Sq Ft)
Lot Size (Sq Ft)
This comp search reflects your current search parameters — adjust the filters above as needed for a more accurate estimate.
Estimated Value
—
Average $/Sqft
—
Check one or more comps below to calculate an estimate.
Nearest 10 of 22 comparable sales and listings within 1 mile of this home. Use the filters above and press Search to refine.
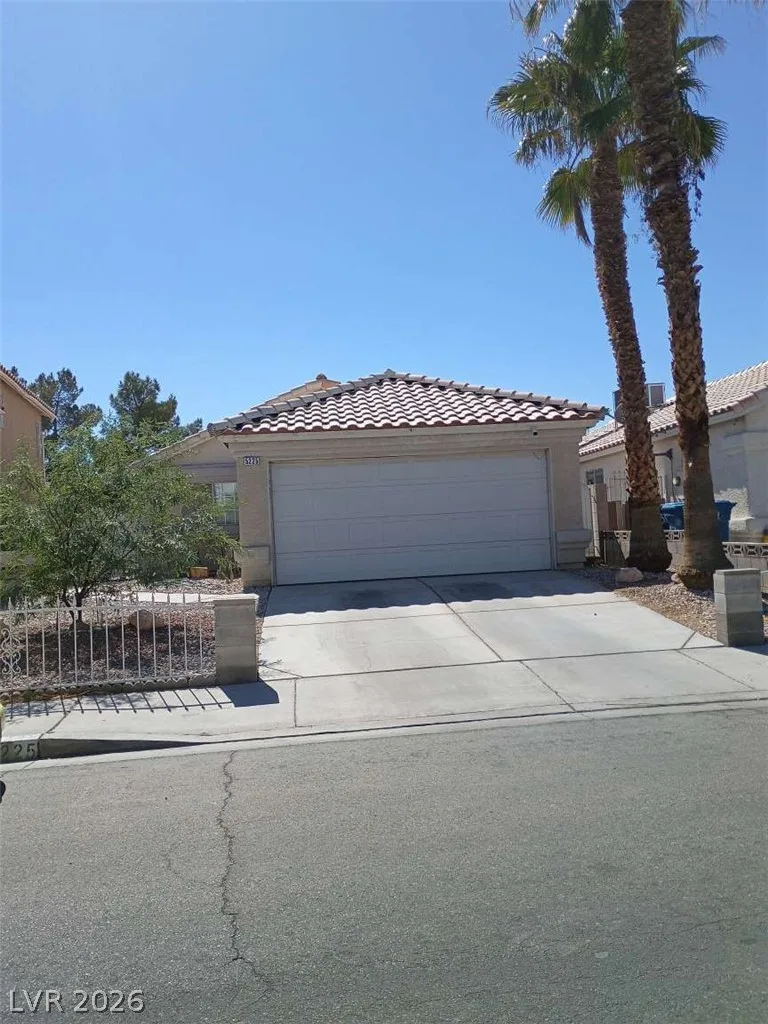
5225 Silverheart AvenueActive
$325,0002 bd2 ba1,052 sqft$309/sqft0.12 mi0 days
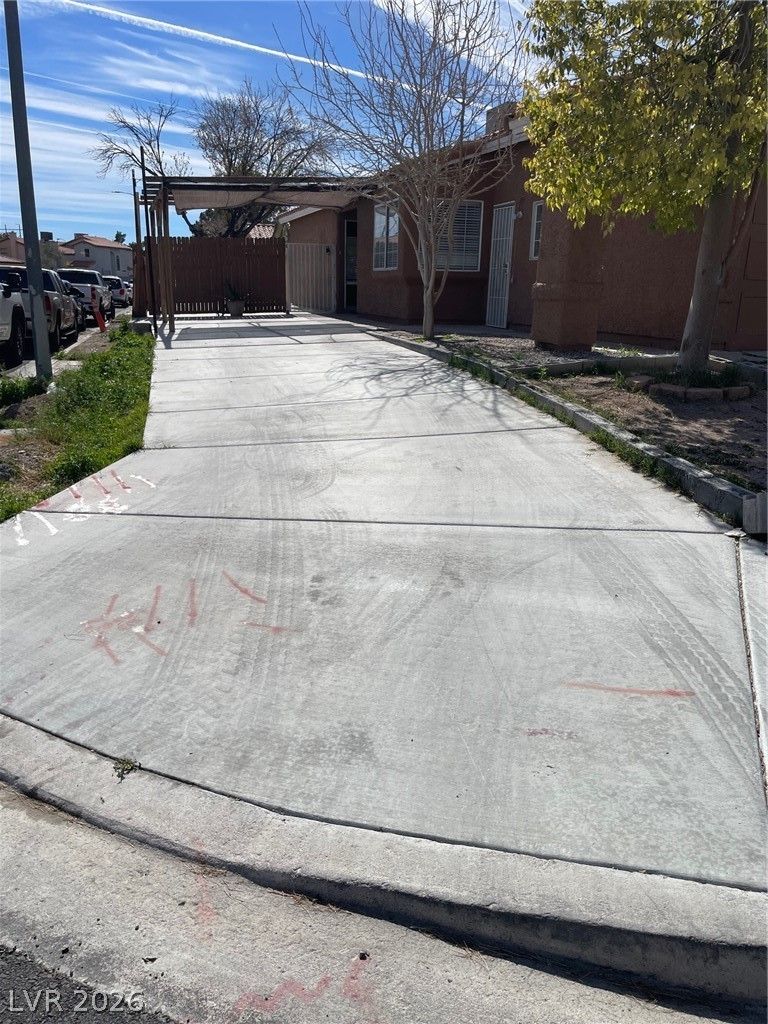
$298,0002 bd2 ba869 sqft$343/sqft0.35 mi12 daysSold 2026-06-12
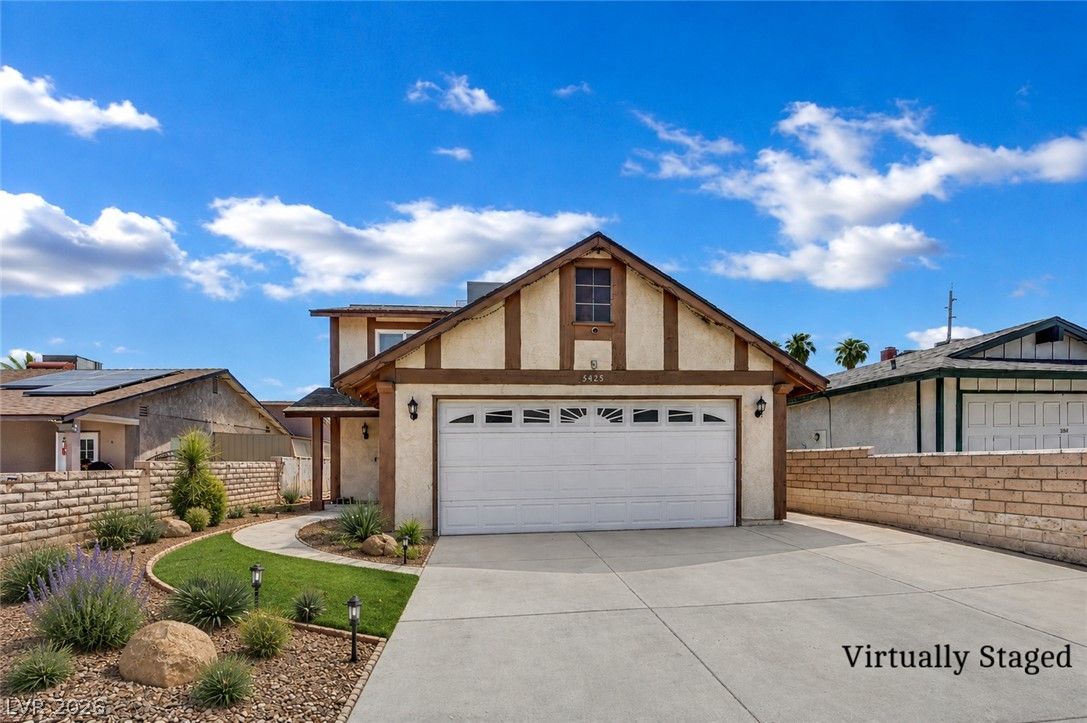
$335,0003 bd3 ba1,260 sqft$266/sqft0.39 mi20 daysSold 2026-10-20
$352,0003 bd2 ba1,200 sqft$293/sqft0.48 mi27 daysSold 2026-06-08

55 North Christy LaneActive
$340,0003 bd2 ba1,226 sqft$277/sqft0.68 mi122 days
$315,0003 bd2 ba1,036 sqft$304/sqft0.71 mi2 daysSold 2026-07-15
$375,0003 bd2 ba1,170 sqft$321/sqft0.72 mi134 daysSold 2026-06-26

2120 Brassy DriveActive
$334,9002 bd2 ba1,052 sqft$318/sqft0.73 mi34 days
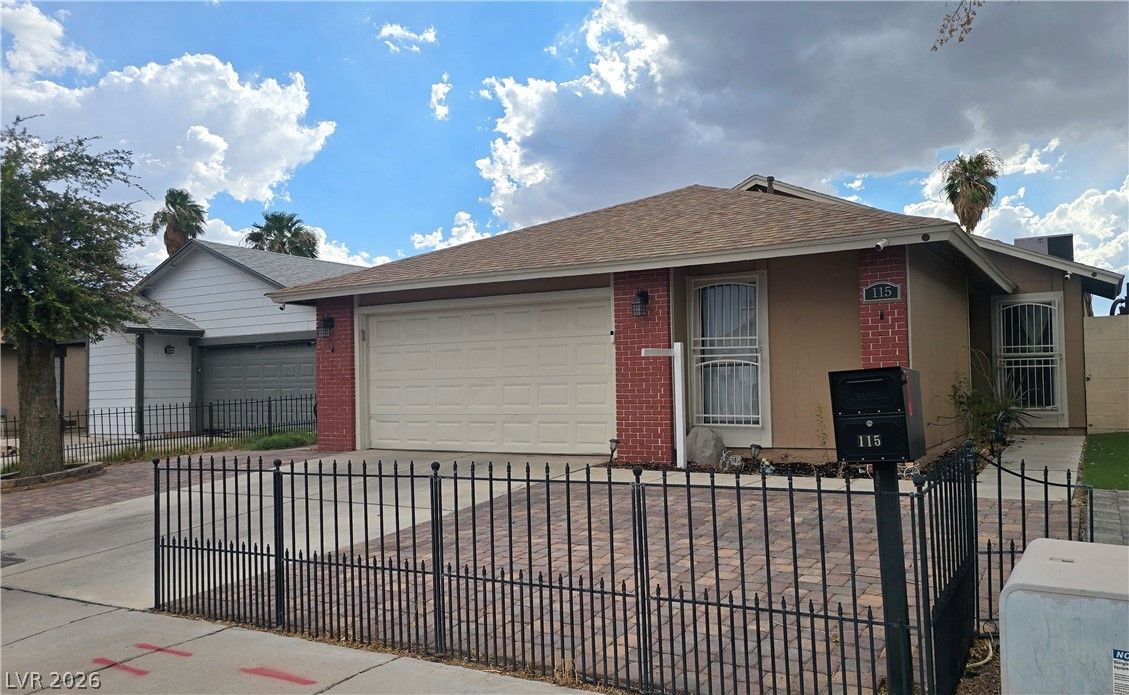
115 Parrish LaneActive
$358,0003 bd2 ba1,287 sqft$278/sqft0.73 mi24 days
$345,0003 bd2 ba1,203 sqft$287/sqft0.74 mi7 daysSold 2026-07-17
Nearest comparable sales and listings
12 comparables · median price $337,500 · range $290,000 – $549,000 · median $/sq ft $306 · average $/sq ft $323
| Address | Status | Price | $/Sq Ft | Bd / Ba | Sq Ft | Sold / market time | Distance |
|---|---|---|---|---|---|---|---|
| 5225 Silverheart Avenue | Active | $325,000 | $309 | 2 / 2 | 1,052 | 0 days on market | 0.12 mi |
| 5389 Signet Court | Sold | $298,000 | $343 | 2 / 2 | 869 | Sold 2026-06-12 | 0.35 mi |
| 5425 Alpaca Circle | Sold | $335,000 | $266 | 3 / 3 | 1,260 | Sold 2026-10-20 | 0.39 mi |
| 4736 Mohave Avenue | Sold | $352,000 | $293 | 3 / 2 | 1,200 | Sold 2026-06-08 | 0.48 mi |
| 55 North Christy Lane | Active | $340,000 | $277 | 3 / 2 | 1,226 | 122 days on market | 0.68 mi |
| 108 Sirnoble Street | Sold | $315,000 | $304 | 3 / 2 | 1,036 | Sold 2026-07-15 | 0.71 mi |
| 4773 Welter Avenue | Sold | $375,000 | $321 | 3 / 2 | 1,170 | Sold 2026-06-26 | 0.72 mi |
| 2120 Brassy Drive | Active | $334,900 | $318 | 2 / 2 | 1,052 | 34 days on market | 0.73 mi |
| 115 Parrish Lane | Active | $358,000 | $278 | 3 / 2 | 1,287 | 24 days on market | 0.73 mi |
| 5636 Fairlight Drive | Sold | $345,000 | $287 | 3 / 2 | 1,203 | Sold 2026-07-17 | 0.74 mi |
| 129 Parrish Lane | Sold | $290,000 | $316 | 2 / 1 | 918 | Sold 2026-06-22 | 0.75 mi |
| 8373 West Rochelle Avenue | Active | $549,000 | $561 | 3 / 3 | 979 | 36 days on market | 0.78 mi |


