
Comparable Sales Near 7374 Valhalla Lane, Las Vegas, NV 89123
1st Realty · Comparable sales report · 1st.estate · October 20, 2026
Browse our Las Vegas area guides →
7374 Valhalla Lane, Las Vegas, NV 89123
Status: Sold
$510,000 Sold Price
$235
$ / Sq Ft
2,172
Living Area
9,583 sqft
Lot Size
4
Beds
3
Baths
1983
Year Built
Search Parameters
Property Type
Status
Radius
Sold Within
Beds
Baths
Living Area (Sq Ft)
Lot Size (Sq Ft)
This comp search reflects your current search parameters — adjust the filters above as needed for a more accurate estimate.
Estimated Value
—
Average $/Sqft
—
Check one or more comps below to calculate an estimate.
Nearest 10 of 29 comparable sales and listings within 1 mile of this home. Use the filters above and press Search to refine.
7339 Gentry LaneSold
$506,0004 bd3 ba2,172 sqft$233/sqft0.04 mi40 daysSold 2026-05-26
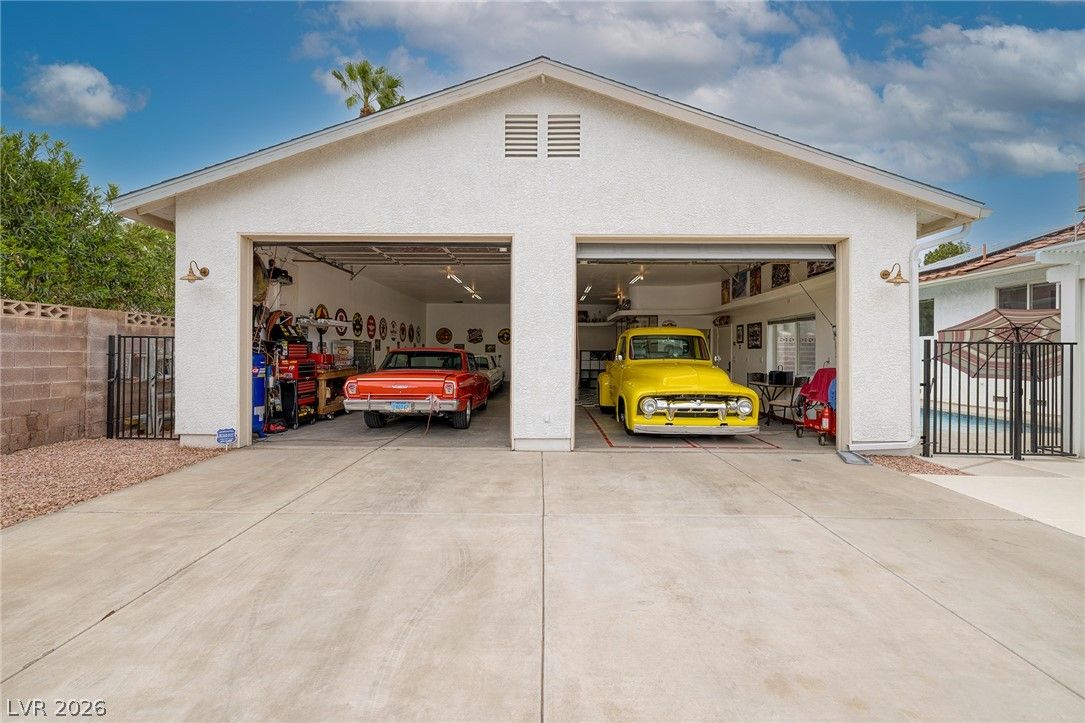
991 Perez PlaceSold
$705,0004 bd4 ba2,172 sqft$325/sqft0.12 mi21 daysSold 2026-10-02
$565,0004 bd2 ba2,389 sqft$237/sqft0.16 mi36 daysSold 2026-06-05
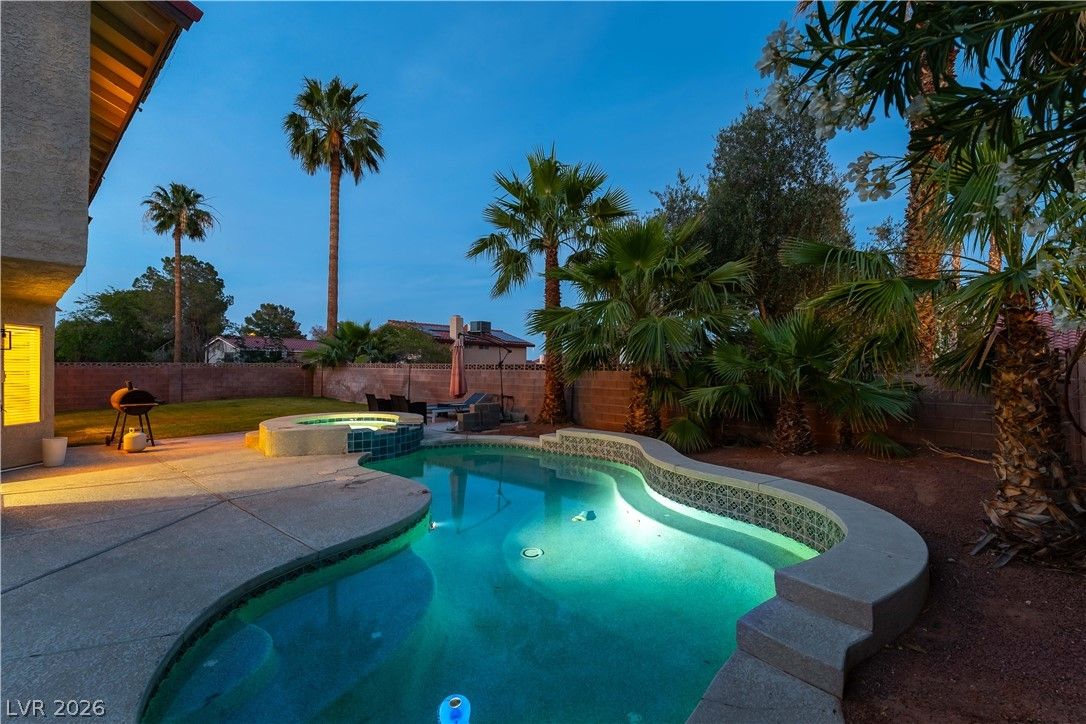
7384 Edgewater LaneActive
$599,0004 bd3 ba2,334 sqft$257/sqft0.18 mi140 days
$530,0004 bd3 ba2,172 sqft$244/sqft0.19 mi5 daysSold 2026-07-10
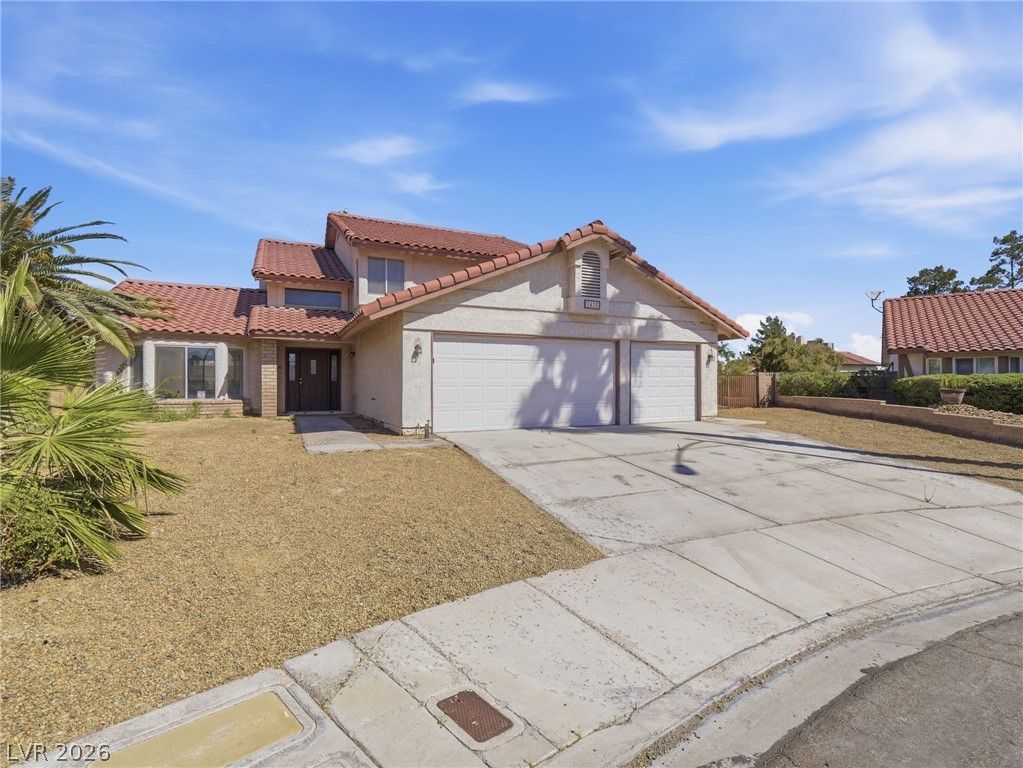
7475 Babbs CourtSold
$525,0004 bd3 ba2,334 sqft$225/sqft0.24 mi31 daysSold 2026-09-15
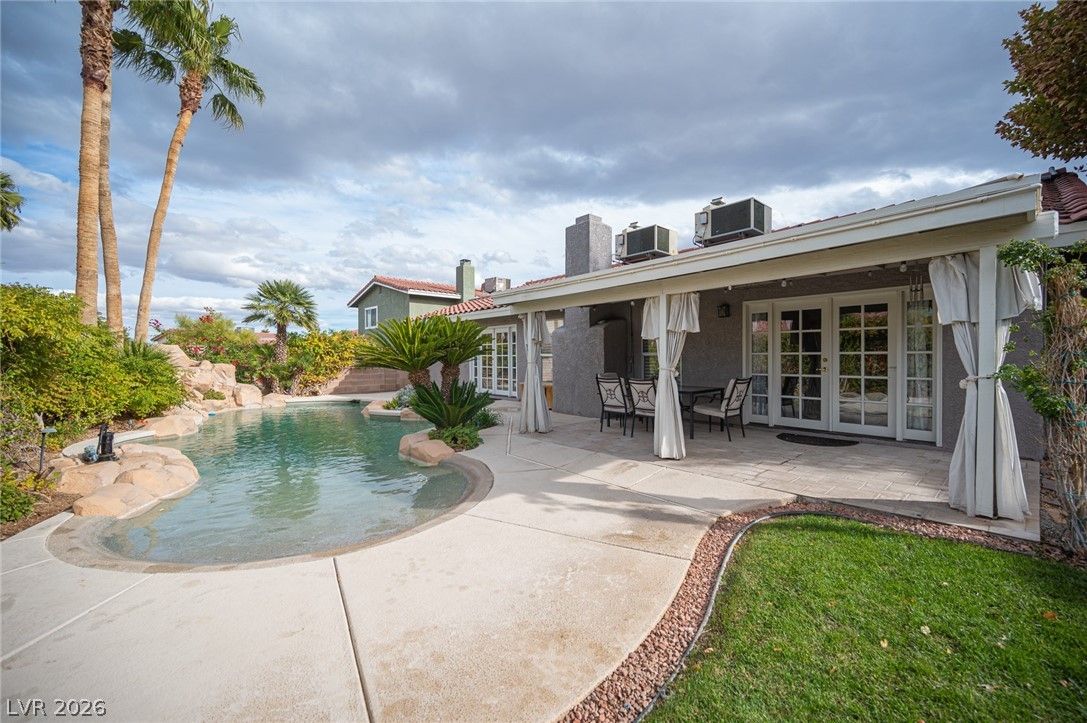
$489,0003 bd2 ba1,640 sqft$298/sqft0.26 mi85 daysSold 2026-08-28
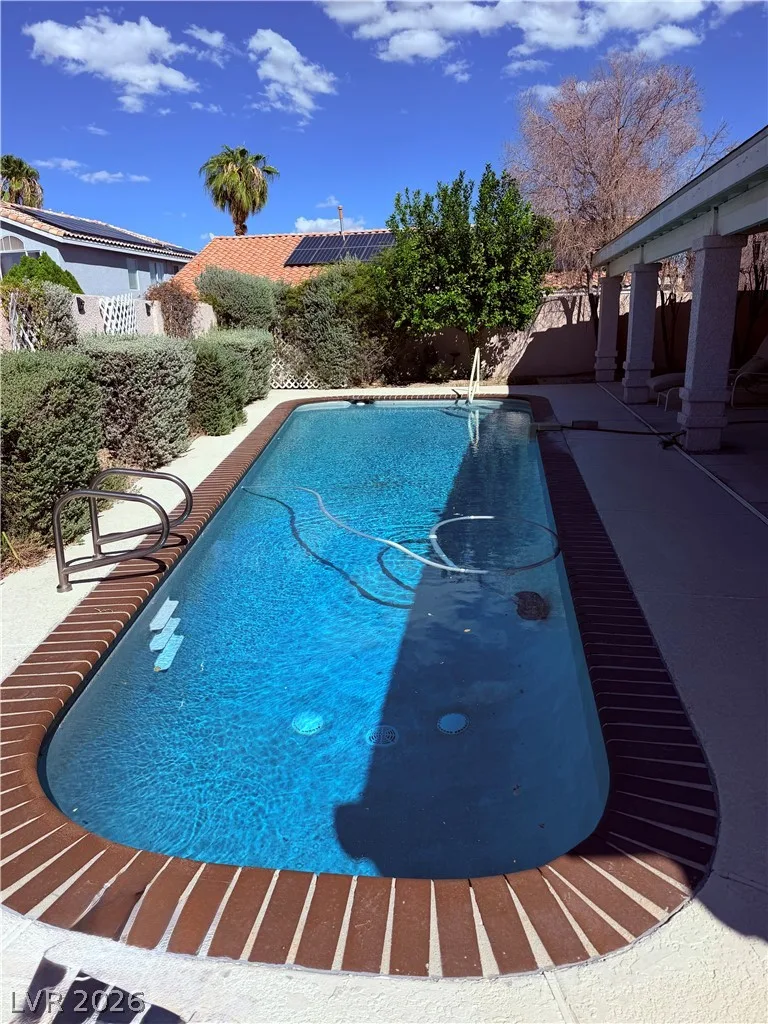
950 Denberry WayActive
$680,0004 bd2 ba2,352 sqft$289/sqft0.30 mi9 days
$556,0003 bd2 ba1,886 sqft$295/sqft0.34 mi0 daysSold 2026-06-05
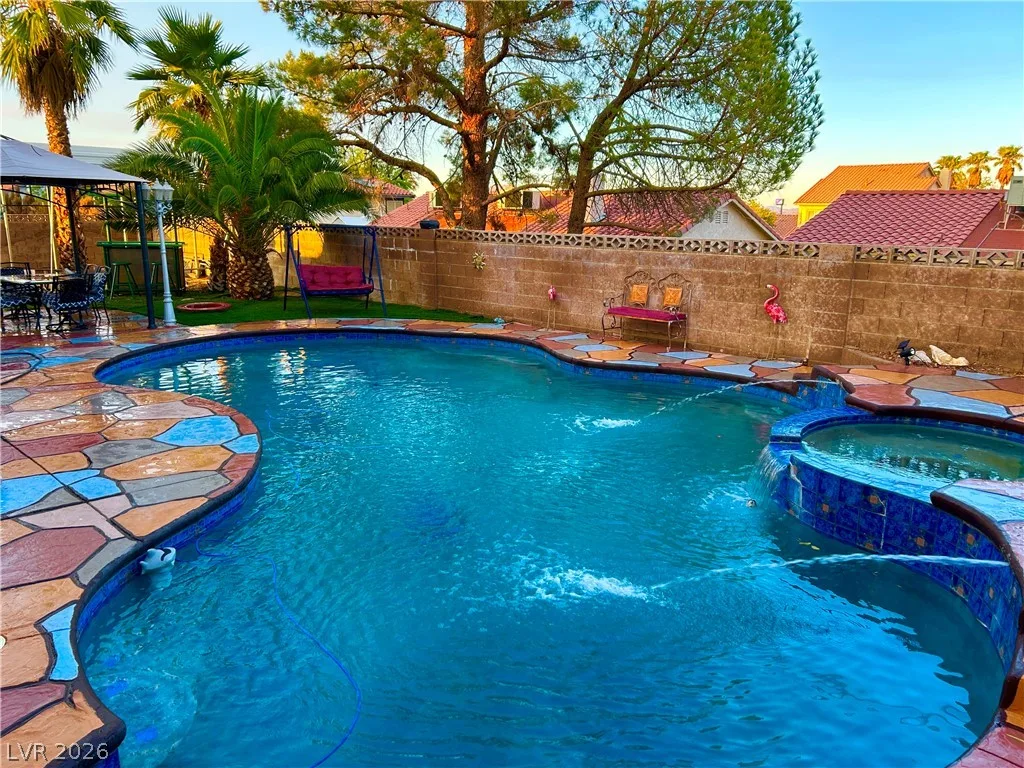
7400 Amigo StreetActive
$649,3004 bd3 ba2,336 sqft$278/sqft0.36 mi0 days
Nearest comparable sales and listings
12 comparables · median price $560,500 · range $489,000 – $705,000 · median $/sq ft $254 · average $/sq ft $262
| Address | Status | Price | $/Sq Ft | Bd / Ba | Sq Ft | Sold / market time | Distance |
|---|---|---|---|---|---|---|---|
| 7339 Gentry Lane | Sold | $506,000 | $233 | 4 / 3 | 2,172 | Sold 2026-05-26 | 0.04 mi |
| 991 Perez Place | Sold | $705,000 | $325 | 4 / 4 | 2,172 | Sold 2026-10-02 | 0.12 mi |
| 982 Pescados Drive | Sold | $565,000 | $237 | 4 / 2 | 2,389 | Sold 2026-06-05 | 0.16 mi |
| 7384 Edgewater Lane | Active | $599,000 | $257 | 4 / 3 | 2,334 | 140 days on market | 0.18 mi |
| 956 East Eldorado Lane | Sold | $530,000 | $244 | 4 / 3 | 2,172 | Sold 2026-07-10 | 0.19 mi |
| 7475 Babbs Court | Sold | $525,000 | $225 | 4 / 3 | 2,334 | Sold 2026-09-15 | 0.24 mi |
| 7423 Edgewater Lane | Sold | $489,000 | $298 | 3 / 2 | 1,640 | Sold 2026-08-28 | 0.26 mi |
| 950 Denberry Way | Active | $680,000 | $289 | 4 / 2 | 2,352 | 9 days on market | 0.30 mi |
| 7419 Picardie Lane | Sold | $556,000 | $295 | 3 / 2 | 1,886 | Sold 2026-06-05 | 0.34 mi |
| 7400 Amigo Street | Active | $649,300 | $278 | 4 / 3 | 2,336 | 0 days on market | 0.36 mi |
| 7628 Poppy Meadow Street | Sold | $505,000 | $207 | 4 / 3 | 2,438 | Sold 2026-08-13 | 0.37 mi |
| 940 Cedarcliff Avenue | Active | $620,000 | $251 | 4 / 3 | 2,468 | 7 days on market | 0.38 mi |


