
Comparable Sales Near 7511 Phoenix Falls Street, North Las Vegas, NV 89084
1st Realty · Comparable sales report · 1st.estate · October 21, 2026
Read the North Las Vegas area guide →
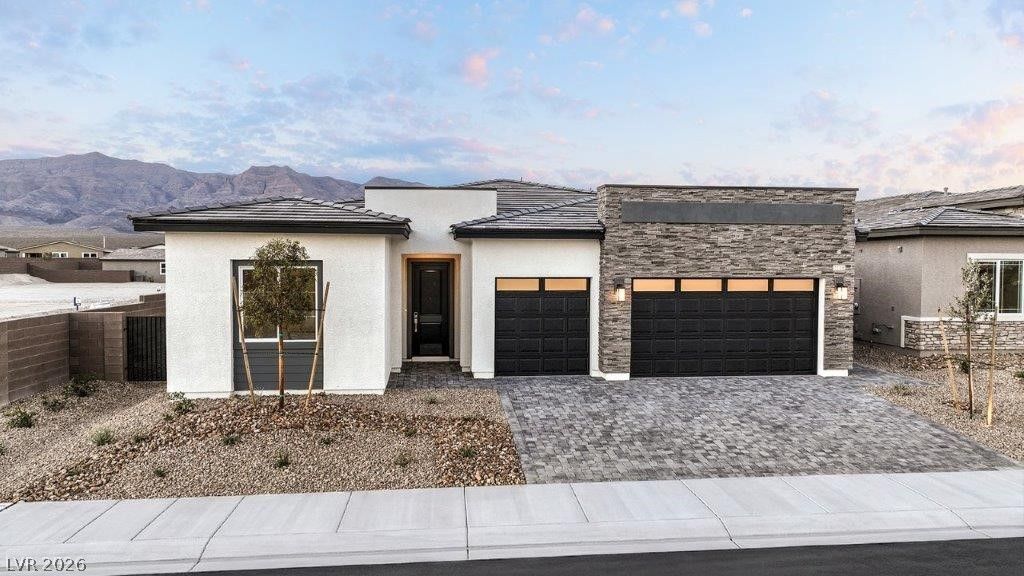
7511 Phoenix Falls Street, North Las Vegas, NV 89084
Status: Sold
$615,000 Sold Price
$240
$ / Sq Ft
2,559
Living Area
6,970 sqft
Lot Size
4
Beds
3
Baths
2024
Year Built
Search Parameters
Property Type
Status
Radius
Sold Within
Beds
Baths
Living Area (Sq Ft)
Lot Size (Sq Ft)
This comp search reflects your current search parameters — adjust the filters above as needed for a more accurate estimate.
Estimated Value
—
Average $/Sqft
—
Check one or more comps below to calculate an estimate.
Nearest 10 of 48 comparable sales and listings within 1 mile of this home. Use the filters above and press Search to refine.
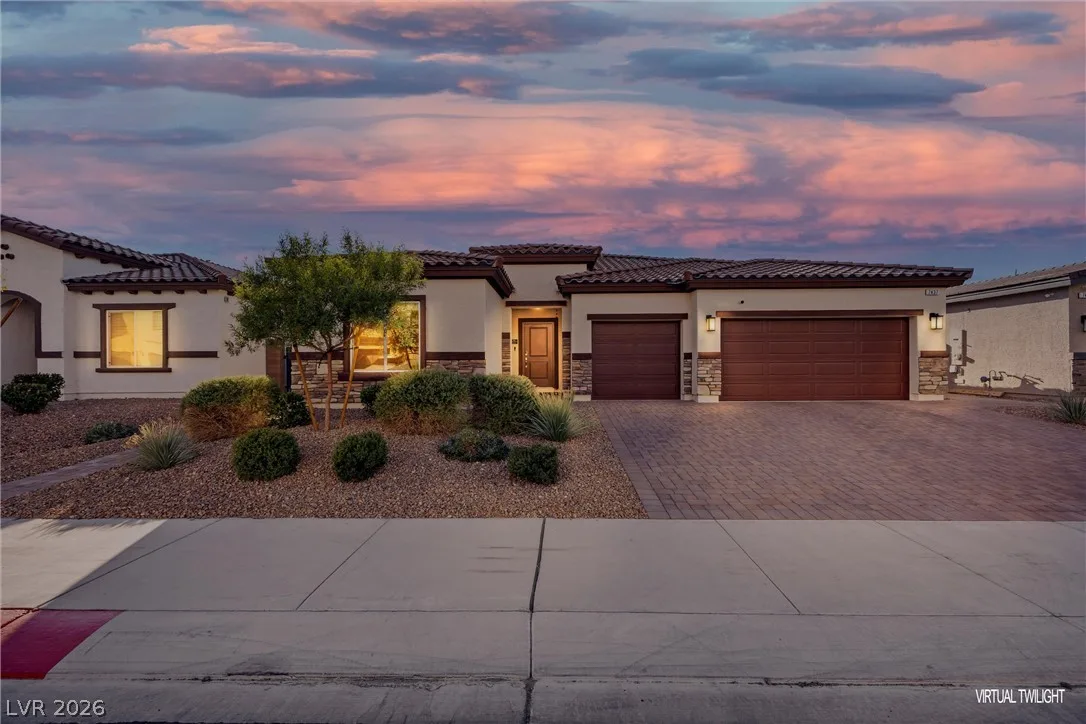
$699,0004 bd3 ba2,779 sqft$252/sqft0.08 mi1 days
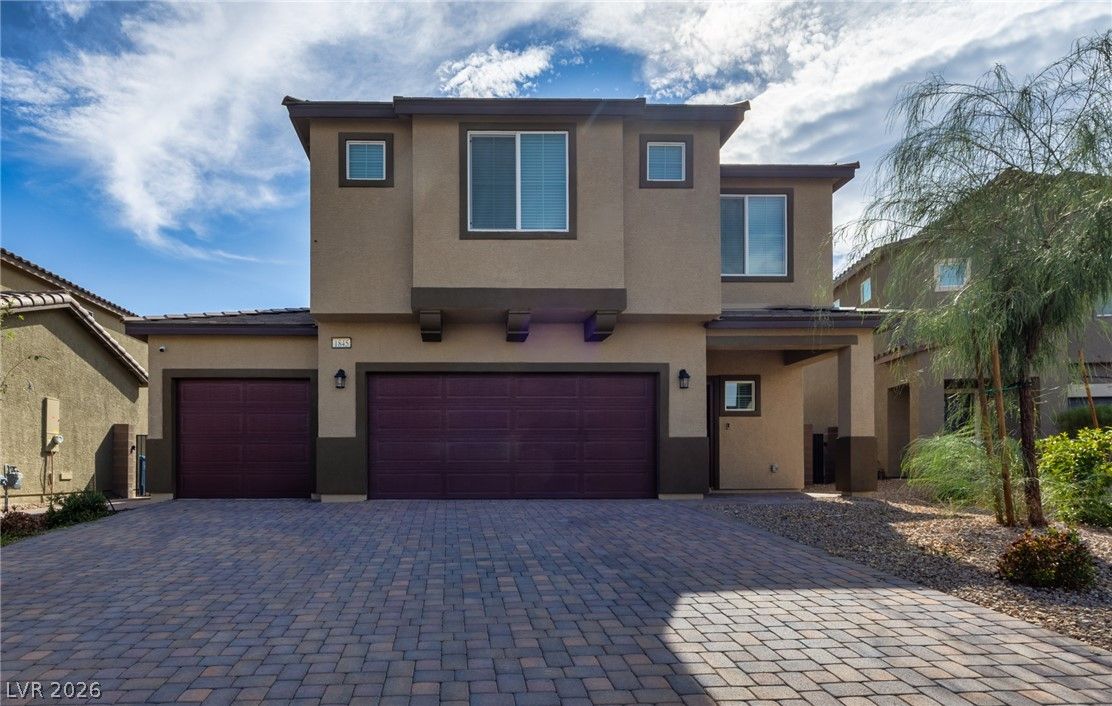
1845 James Creek DriveActive
$570,0005 bd3 ba2,659 sqft$214/sqft0.11 mi30 days
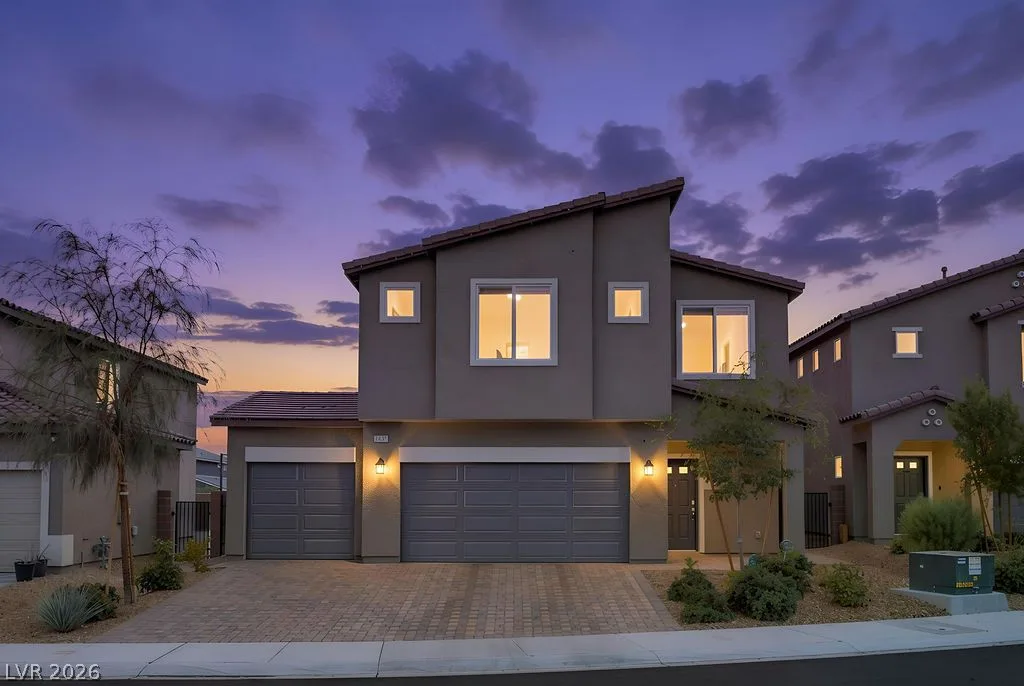
1837 James Creek DriveActive
$650,0005 bd3 ba2,659 sqft$244/sqft0.12 mi5 days
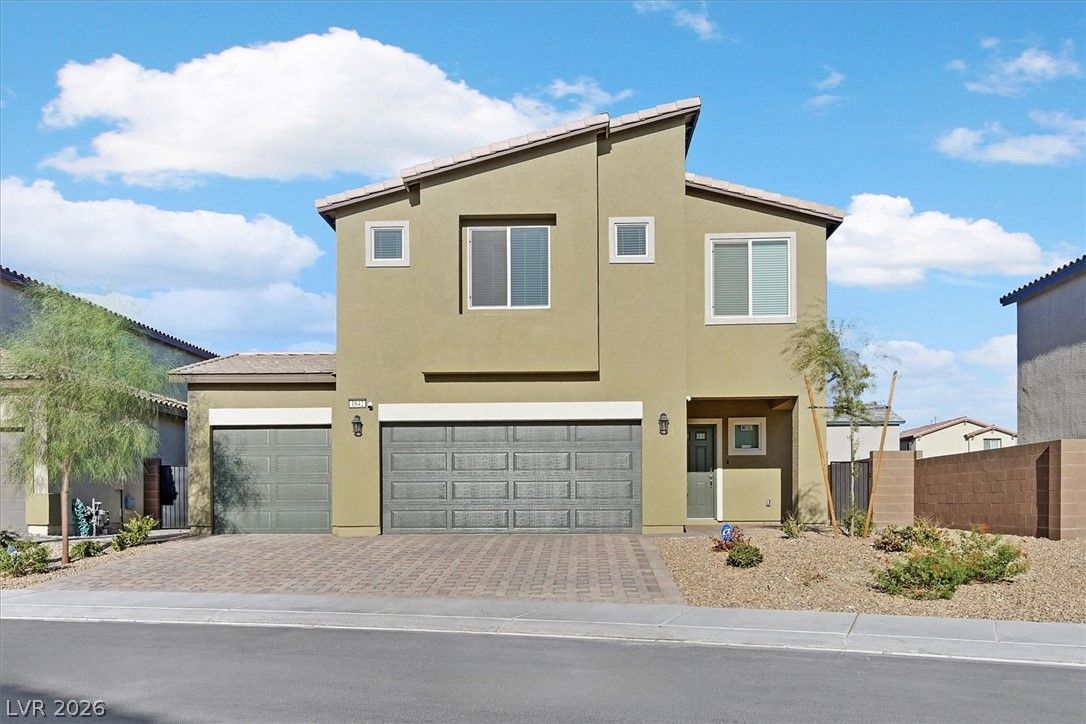
1842 Farah Falls PlaceActive
$524,9004 bd3 ba2,406 sqft$218/sqft0.22 mi69 days
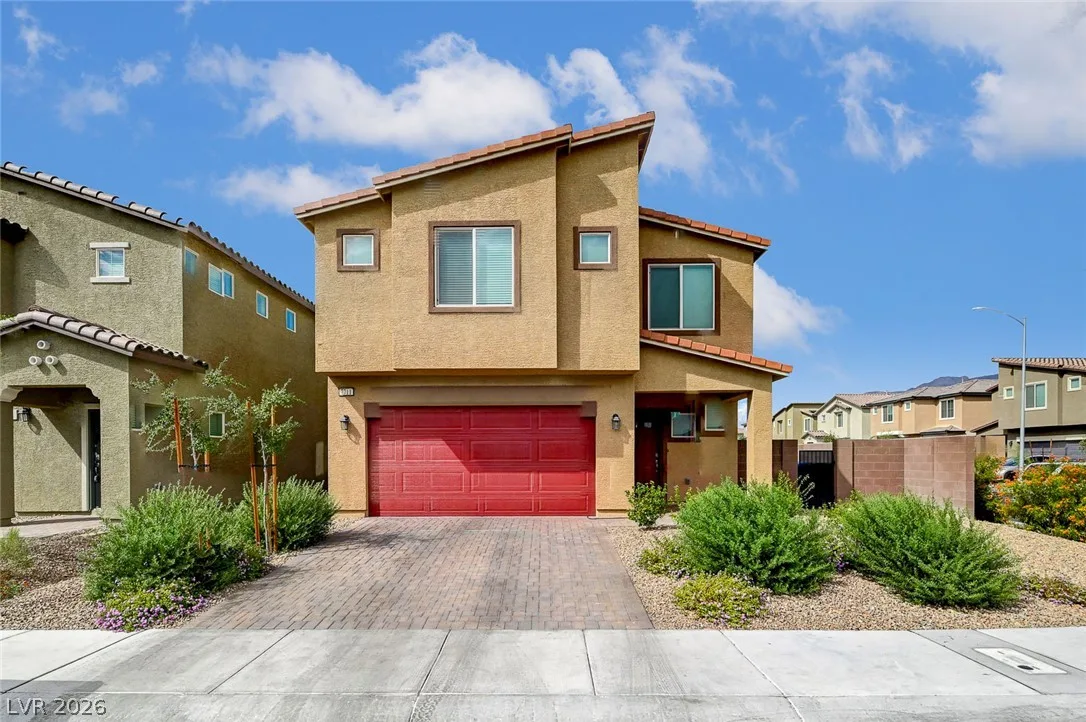
7711 Duran Harbor LaneActive
$500,0005 bd3 ba2,660 sqft$188/sqft0.34 mi0 days
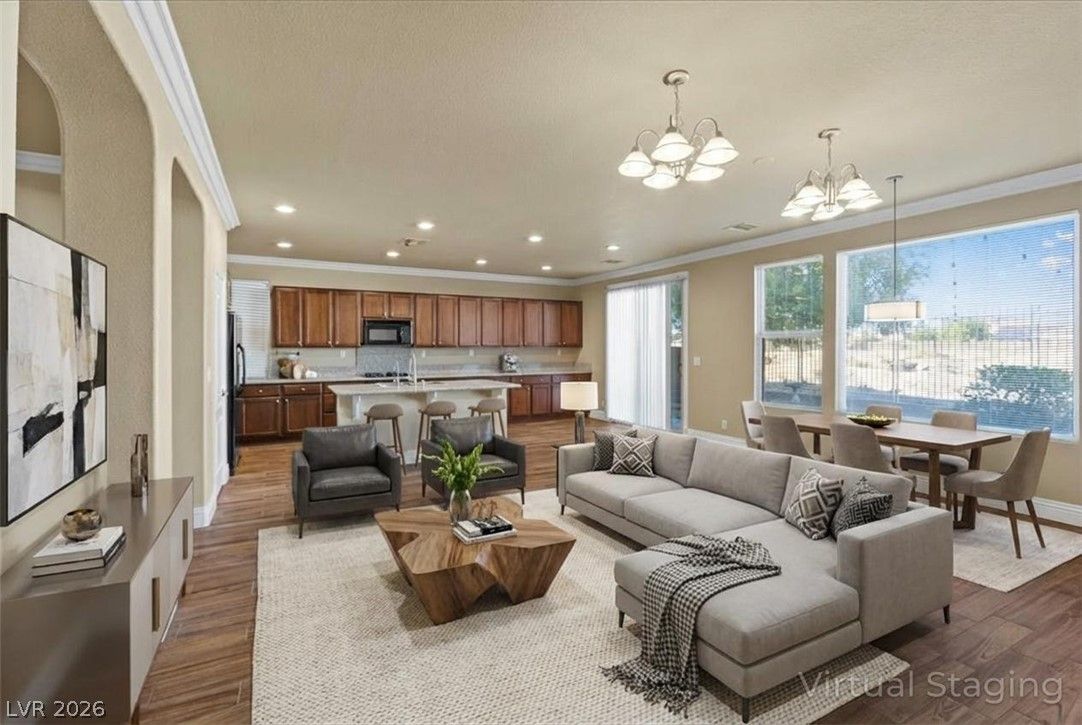
7149 Pipers RunSold
$540,0003 bd3 ba2,512 sqft$215/sqft0.42 mi39 daysSold 2026-08-27
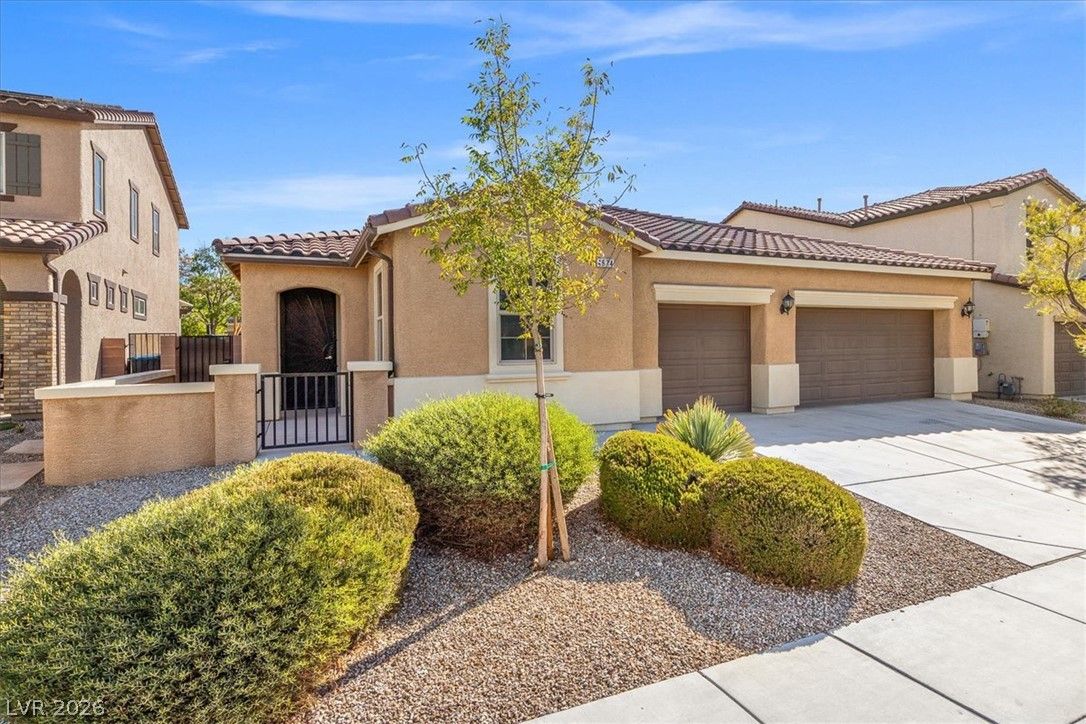
1874 Nature Park DriveActive
$565,0004 bd3 ba2,325 sqft$243/sqft0.45 mi11 days
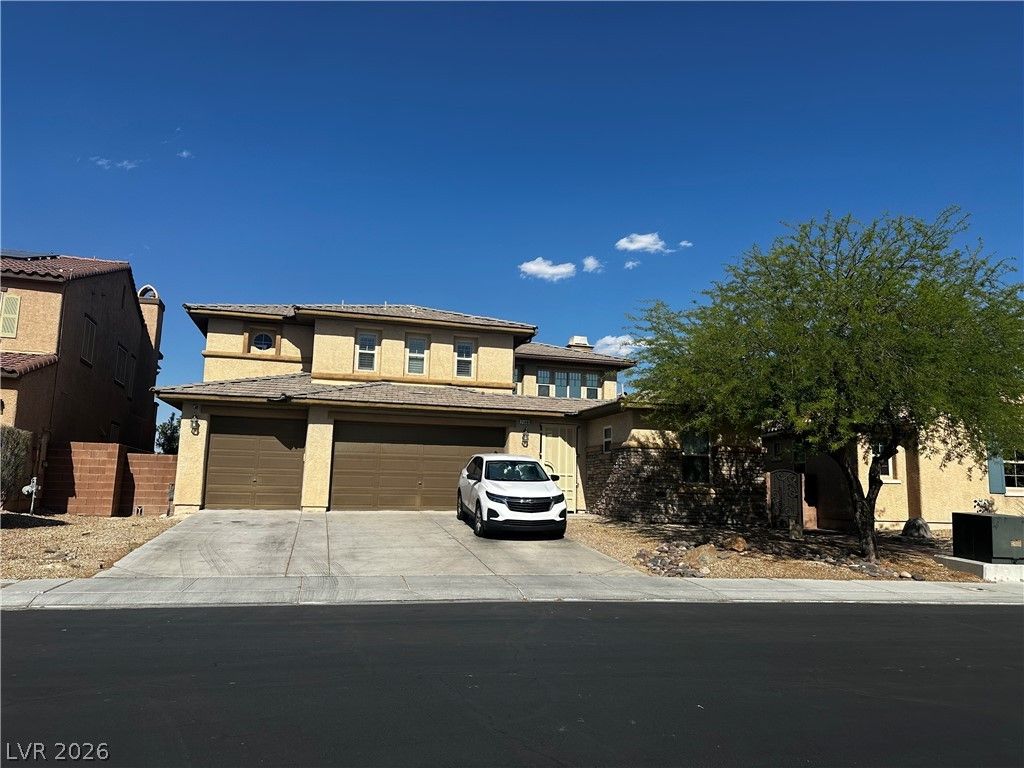
$580,0004 bd3 ba3,084 sqft$188/sqft0.48 mi0 days
$714,5304 bd3 ba2,754 sqft$259/sqft0.52 mi36 daysSold 2026-06-12
$689,9904 bd3 ba2,754 sqft$251/sqft0.52 mi27 daysSold 2026-08-28
Nearest comparable sales and listings
12 comparables · median price $578,495 · range $500,000 – $714,530 · median $/sq ft $224 · average $/sq ft $225
| Address | Status | Price | $/Sq Ft | Bd / Ba | Sq Ft | Sold / market time | Distance |
|---|---|---|---|---|---|---|---|
| 7437 Phoenix Falls Street | Active | $699,000 | $252 | 4 / 3 | 2,779 | 1 days on market | 0.08 mi |
| 1845 James Creek Drive | Active | $570,000 | $214 | 5 / 3 | 2,659 | 30 days on market | 0.11 mi |
| 1837 James Creek Drive | Active | $650,000 | $244 | 5 / 3 | 2,659 | 5 days on market | 0.12 mi |
| 1842 Farah Falls Place | Active | $524,900 | $218 | 4 / 3 | 2,406 | 69 days on market | 0.22 mi |
| 7711 Duran Harbor Lane | Active | $500,000 | $188 | 5 / 3 | 2,660 | 0 days on market | 0.34 mi |
| 7149 Pipers Run | Sold | $540,000 | $215 | 3 / 3 | 2,512 | Sold 2026-08-27 | 0.42 mi |
| 1874 Nature Park Drive | Active | $565,000 | $243 | 4 / 3 | 2,325 | 11 days on market | 0.45 mi |
| 7148 Charter Crest Street | Active | $580,000 | $188 | 4 / 3 | 3,084 | 0 days on market | 0.48 mi |
| 7666 Amanda Springs Lane | Sold | $714,530 | $259 | 4 / 3 | 2,754 | Sold 2026-06-12 | 0.52 mi |
| 1204 Ryan River Place | Sold | $689,990 | $251 | 4 / 3 | 2,754 | Sold 2026-08-28 | 0.52 mi |
| 1965 Michael Springs Place | Sold | $640,000 | $230 | 4 / 3 | 2,779 | Sold 2026-05-15 | 0.53 mi |
| 1821 Shondra Court | Under Contract | $576,990 | $192 | 5 / 3 | 3,000 | 6 days on market | 0.55 mi |


