
Comparable Sales Near 7295 Anembo Avenue, Las Vegas, NV 89178
1st Realty · Comparable sales report · 1st.estate · October 20, 2026
Read the Enterprise neighborhood guide →
7295 Anembo Avenue, Las Vegas, NV 89178
Status: Sold
$2,249 Sold Price
$1
$ / Sq Ft
2,251
Living Area
3,920 sqft
Lot Size
3
Beds
3
Baths
2008
Year Built
Search Parameters
Property Type
Status
Radius
Sold Within
Beds
Baths
Living Area (Sq Ft)
Lot Size (Sq Ft)
This comp search reflects your current search parameters — adjust the filters above as needed for a more accurate estimate.
Estimated Value
—
Average $/Sqft
—
Check one or more comps below to calculate an estimate.
Nearest 10 of 63 comparable sales and listings within 1 mile of this home. Use the filters above and press Search to refine.
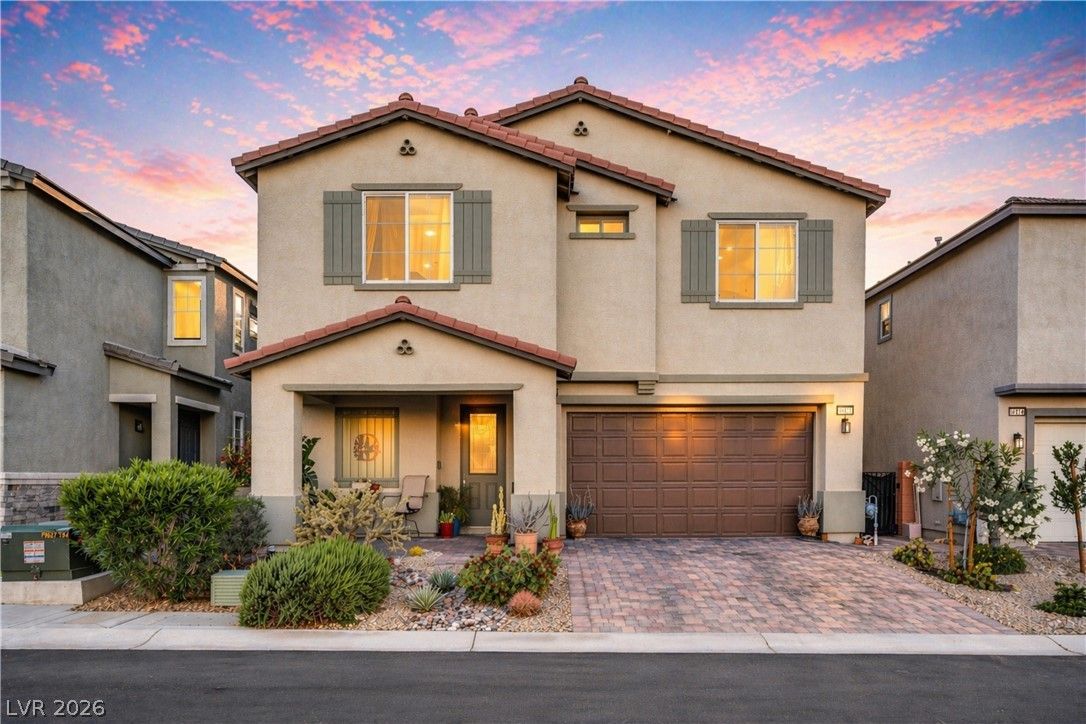
$492,0003 bd3 ba2,233 sqft$220/sqft0.04 mi7 daysSold 2026-04-30
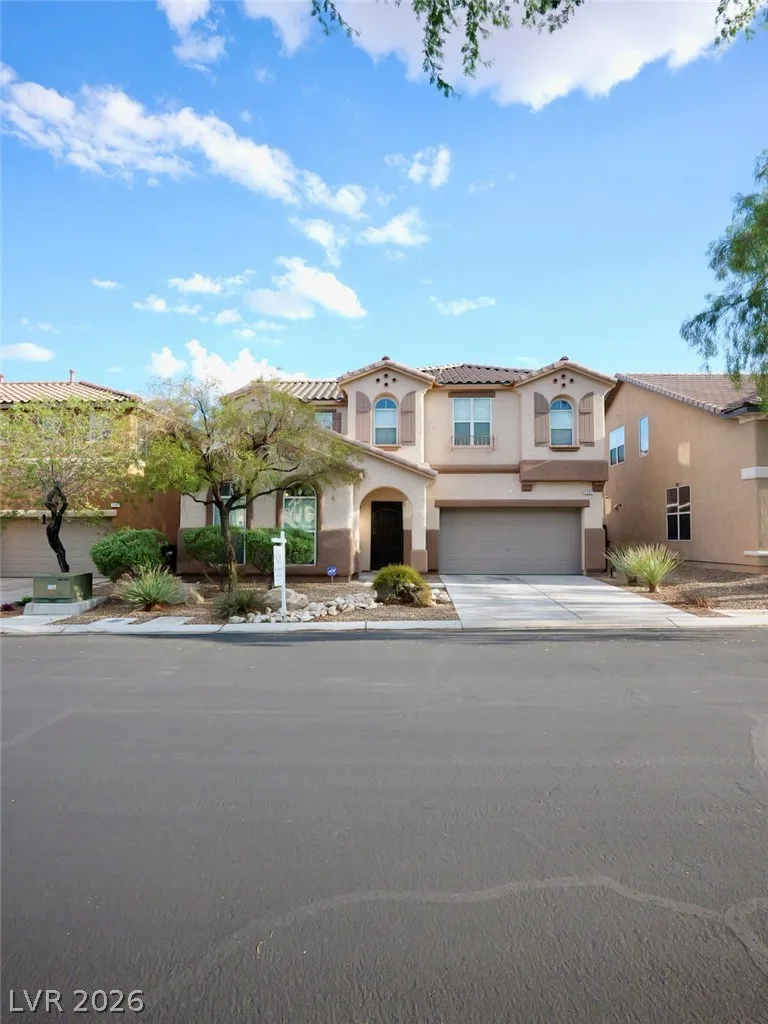
$548,9993 bd3 ba2,465 sqft$223/sqft0.10 mi53 days
7207 Cabarita AvenuePending
$399,9993 bd3 ba1,874 sqft$213/sqft0.10 mi28 days
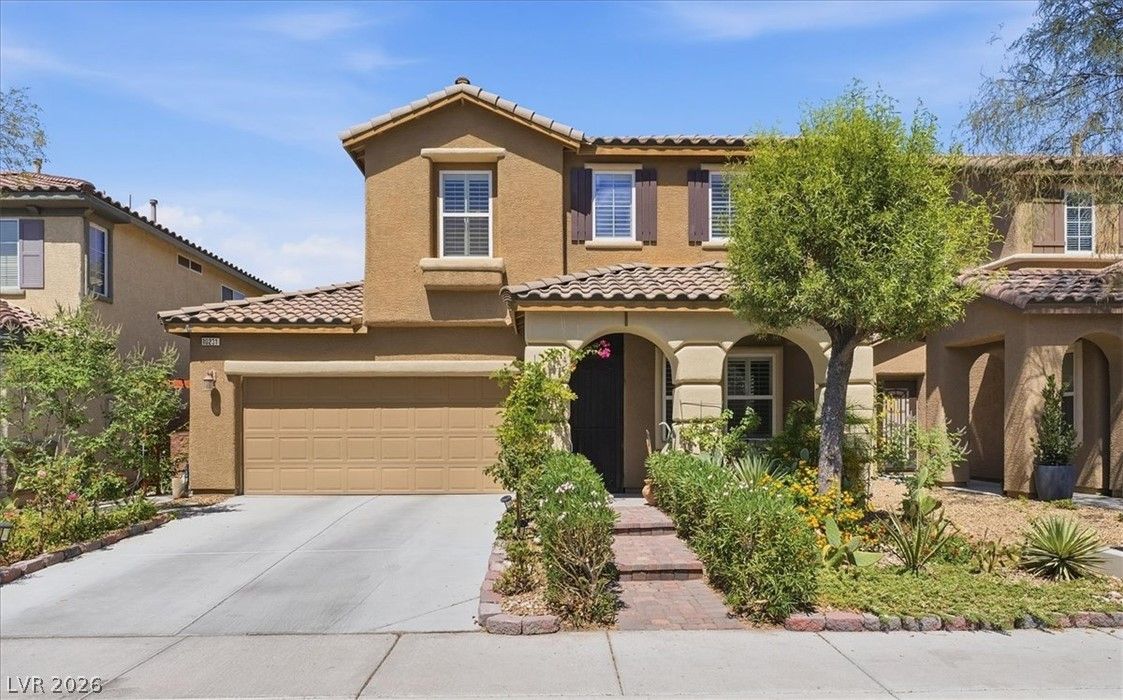
$459,0003 bd3 ba2,027 sqft$226/sqft0.10 mi21 daysSold 2026-07-31
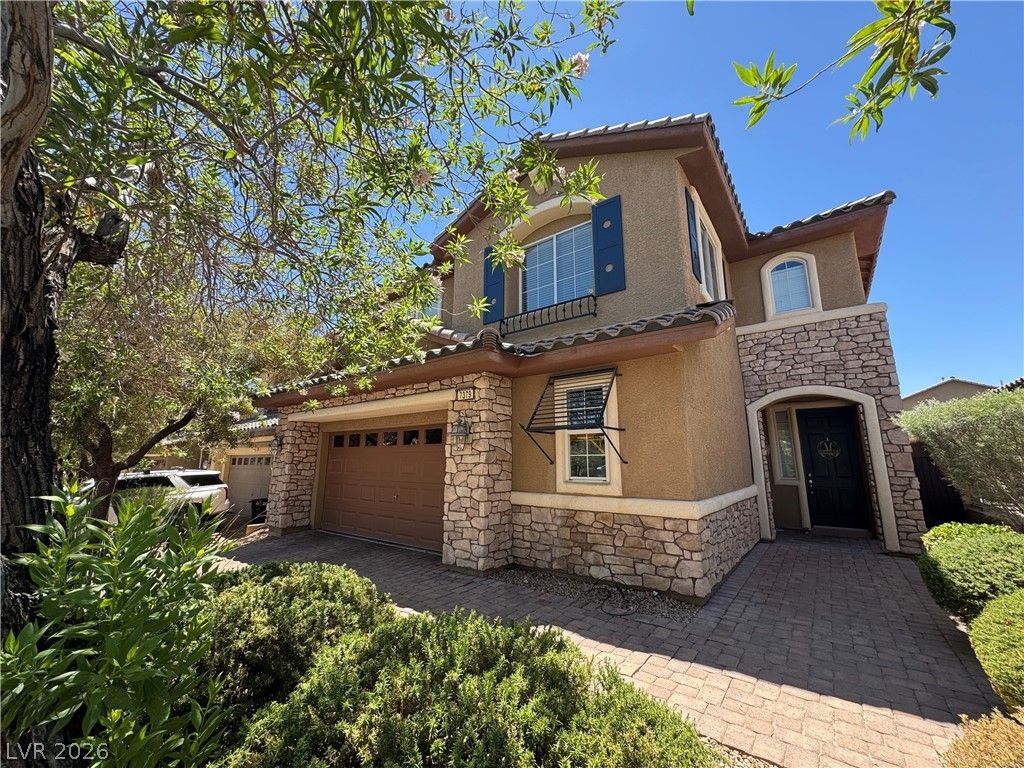
$570,0004 bd3 ba2,661 sqft$214/sqft0.10 mi24 daysSold 2026-09-30

10165 Tait StreetActive
$429,0003 bd3 ba1,874 sqft$229/sqft0.14 mi45 days
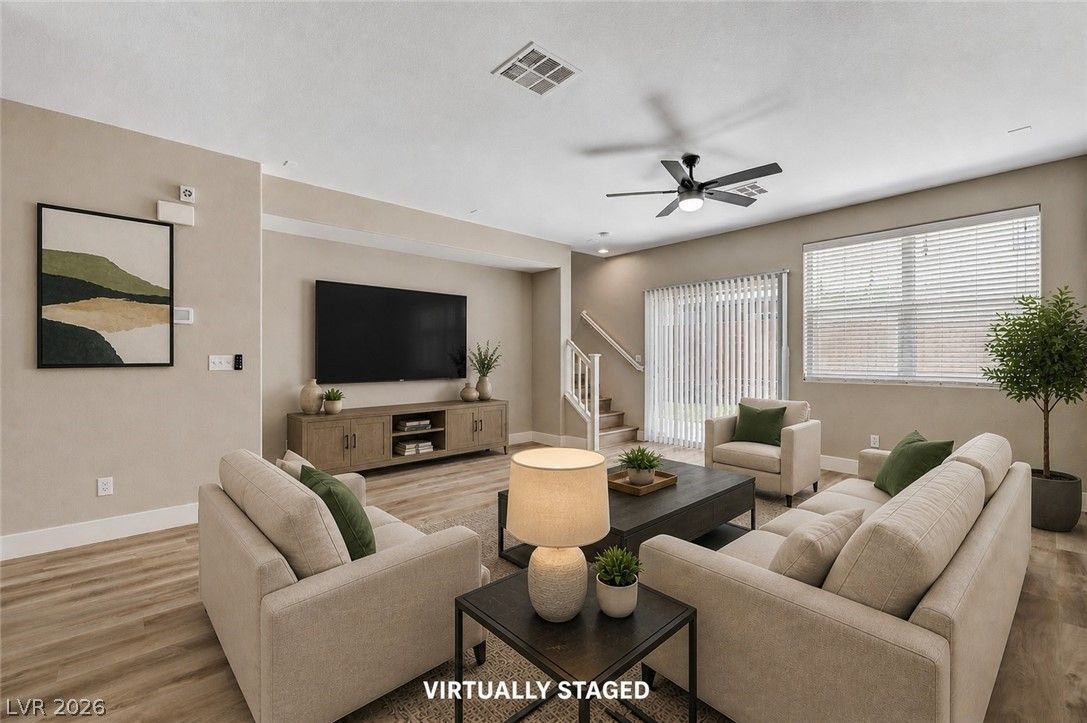
$439,5003 bd3 ba1,874 sqft$235/sqft0.18 mi41 daysSold 2026-09-16
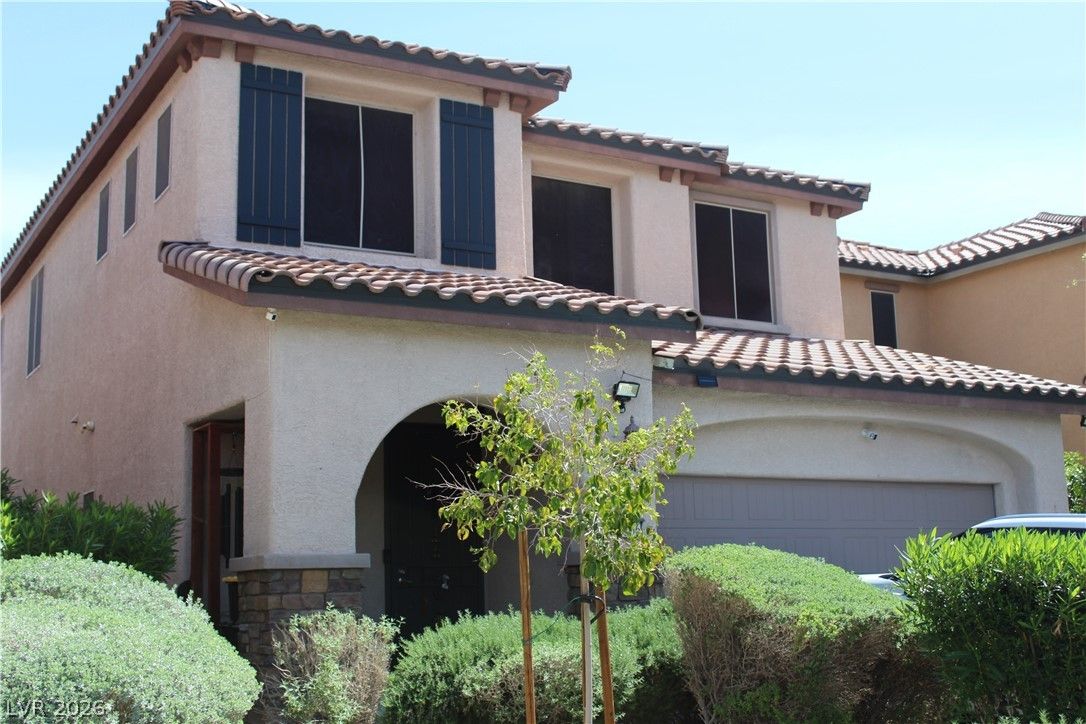
10266 Copalito DriveActive
$479,0004 bd4 ba2,337 sqft$205/sqft0.25 mi82 days
$485,0003 bd3 ba2,225 sqft$218/sqft0.25 mi1 daysSold 2026-07-07
$480,0003 bd3 ba2,076 sqft$231/sqft0.28 mi99 daysSold 2026-04-23
Nearest comparable sales and listings
12 comparables · median price $479,500 · range $399,999 – $570,000 · median $/sq ft $222 · average $/sq ft $222
| Address | Status | Price | $/Sq Ft | Bd / Ba | Sq Ft | Sold / market time | Distance |
|---|---|---|---|---|---|---|---|
| 7287 Cabarita Avenue | Sold | $492,000 | $220 | 3 / 3 | 2,233 | Sold 2026-04-30 | 0.04 mi |
| 10133 Tenaya Meadows Street | Active | $548,999 | $223 | 3 / 3 | 2,465 | 53 days on market | 0.10 mi |
| 7207 Cabarita Avenue | Pending | $399,999 | $213 | 3 / 3 | 1,874 | 28 days on market | 0.10 mi |
| 10231 Montes Vascos Drive | Sold | $459,000 | $226 | 3 / 3 | 2,027 | Sold 2026-07-31 | 0.10 mi |
| 7379 Glorious Sun Drive | Sold | $570,000 | $214 | 4 / 3 | 2,661 | Sold 2026-09-30 | 0.10 mi |
| 10165 Tait Street | Active | $429,000 | $229 | 3 / 3 | 1,874 | 45 days on market | 0.14 mi |
| 10157 Vickers Street | Sold | $439,500 | $235 | 3 / 3 | 1,874 | Sold 2026-09-16 | 0.18 mi |
| 10266 Copalito Drive | Active | $479,000 | $205 | 4 / 4 | 2,337 | 82 days on market | 0.25 mi |
| 7250 Sterling Rock Avenue | Sold | $485,000 | $218 | 3 / 3 | 2,225 | Sold 2026-07-07 | 0.25 mi |
| 10437 Camp Rock Court | Sold | $480,000 | $231 | 3 / 3 | 2,076 | Sold 2026-04-23 | 0.28 mi |
| 10281 Numaga Road | Sold | $465,000 | $234 | 3 / 3 | 1,991 | Sold 2026-05-04 | 0.28 mi |
| 7028 Amapa Road | Active | $499,000 | $214 | 4 / 3 | 2,336 | 58 days on market | 0.29 mi |


