
Comparable Sales Near 8807 Red Fox Drive, Las Vegas, NV 89123
1st Realty · Comparable sales report · 1st.estate · October 20, 2026
Browse our Las Vegas area guides →
8807 Red Fox Drive, Las Vegas, NV 89123
Status: Sold
$2,289 Sold Price
$1
$ / Sq Ft
1,866
Living Area
3,920 sqft
Lot Size
3
Beds
3
Baths
2006
Year Built
Search Parameters
Property Type
Status
Radius
Sold Within
Beds
Baths
Living Area (Sq Ft)
Lot Size (Sq Ft)
This comp search reflects your current search parameters — adjust the filters above as needed for a more accurate estimate.
Estimated Value
—
Average $/Sqft
—
Check one or more comps below to calculate an estimate.
Nearest 10 of 28 comparable sales and listings within 1 mile of this home. Use the filters above and press Search to refine.
$425,0004 bd3 ba2,054 sqft$207/sqft0.04 mi50 daysSold 2026-05-12
$465,0003 bd3 ba2,274 sqft$204/sqft0.05 mi31 daysSold 2026-05-07
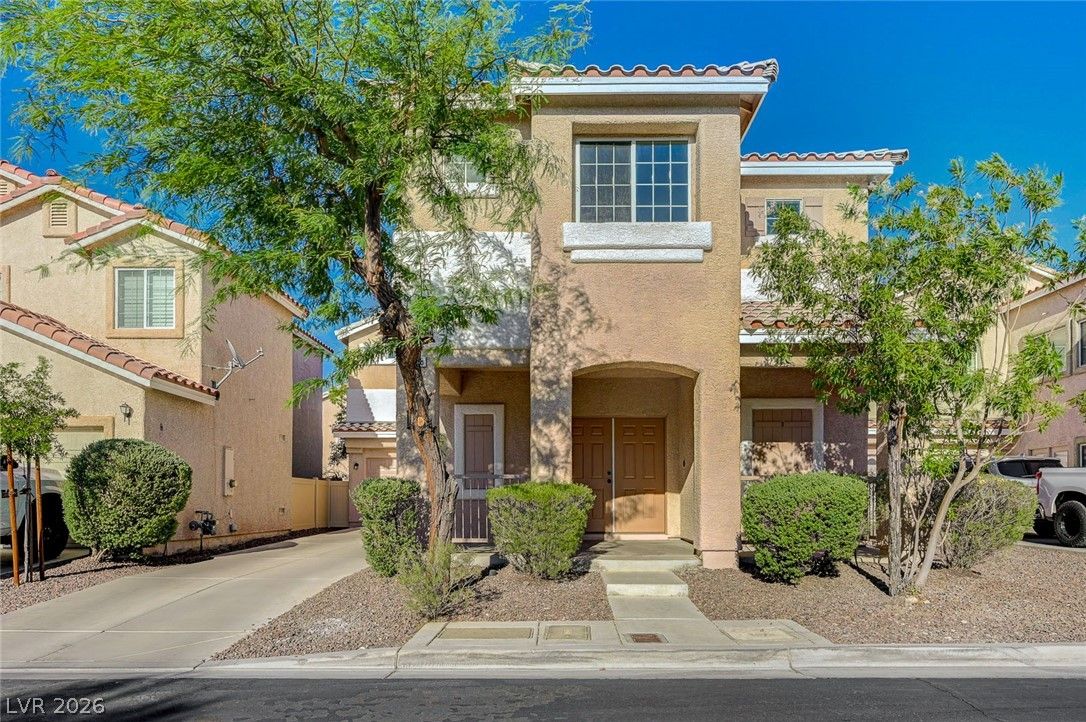
$455,0003 bd3 ba2,274 sqft$200/sqft0.09 mi50 daysSold 2026-08-28
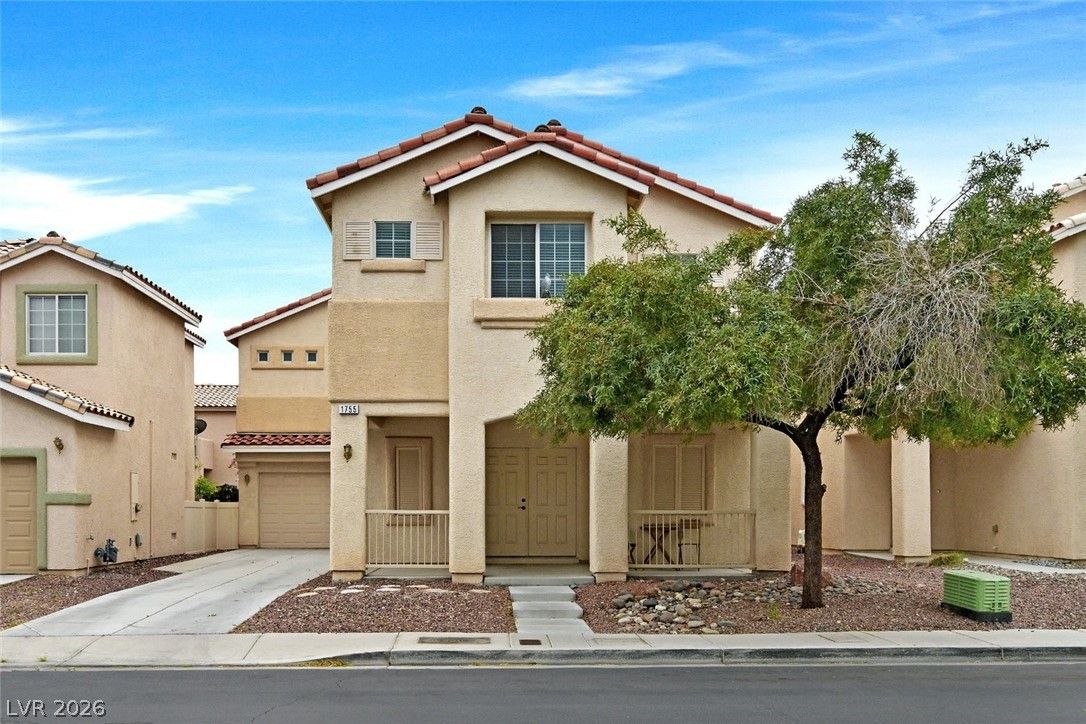
$454,0003 bd3 ba2,274 sqft$200/sqft0.10 mi45 daysSold 2026-08-31

1810 Pebble Cove AvenueActive
$419,0004 bd2 ba1,588 sqft$264/sqft0.25 mi39 days
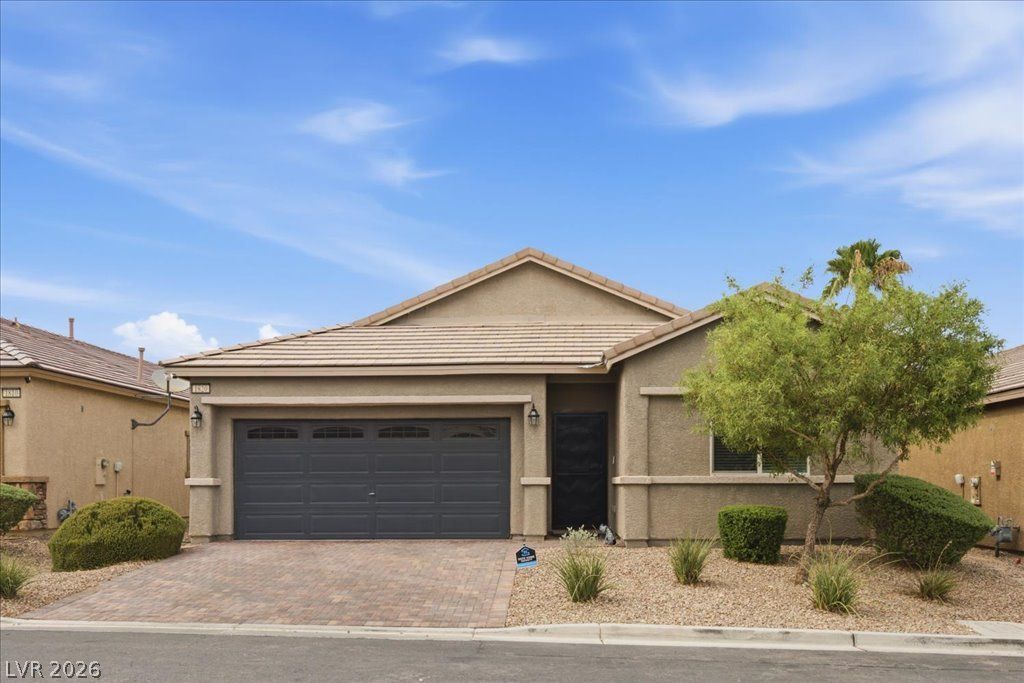
$425,0003 bd2 ba1,582 sqft$269/sqft0.26 mi0 daysSold 2026-09-30

8859 Keywood StreetActive
$495,0004 bd3 ba1,942 sqft$255/sqft0.46 mi52 days
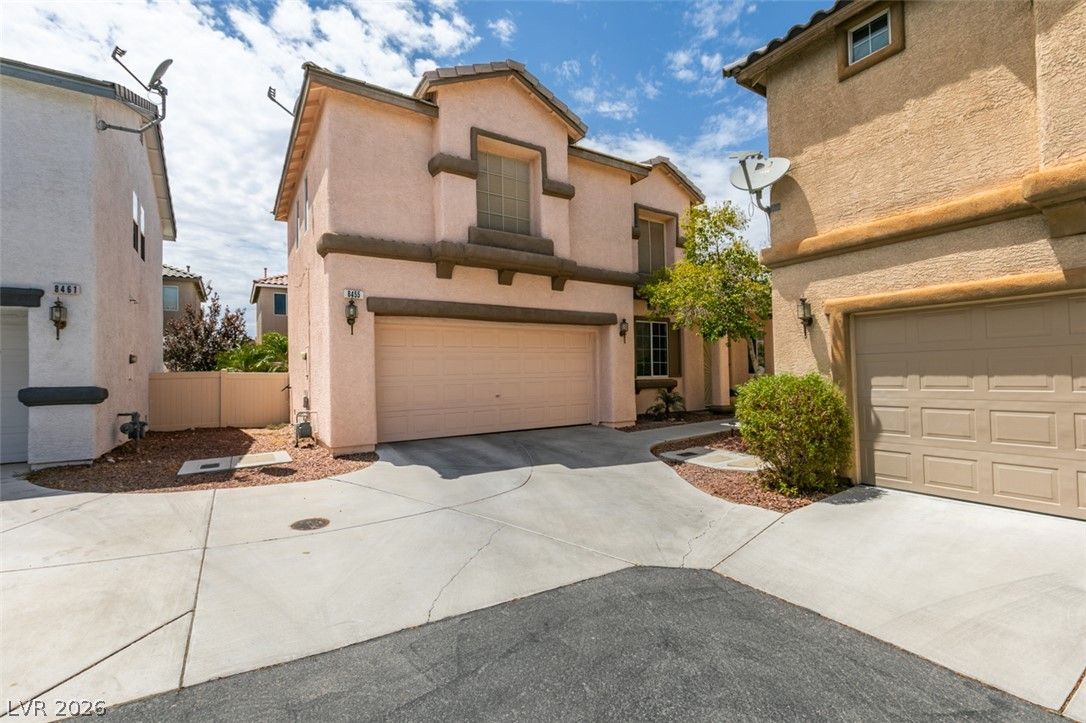
$430,0004 bd3 ba1,994 sqft$216/sqft0.46 mi6 daysSold 2026-09-03
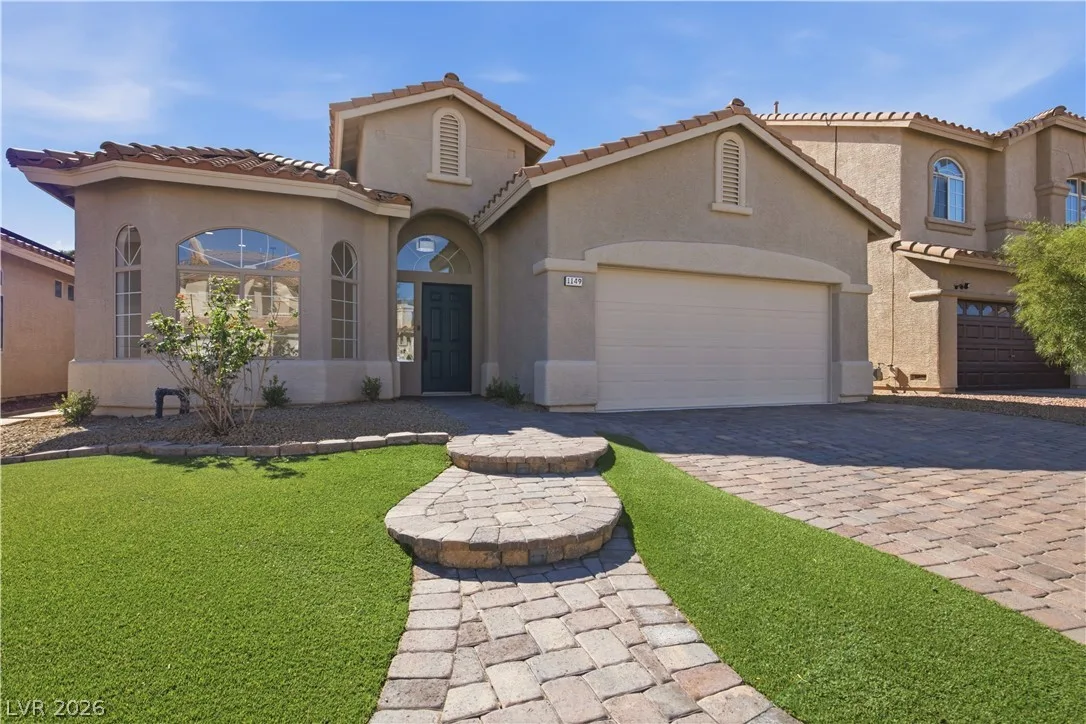
1149 Coral Desert DriveActive
$529,9993 bd2 ba1,841 sqft$288/sqft0.47 mi0 days
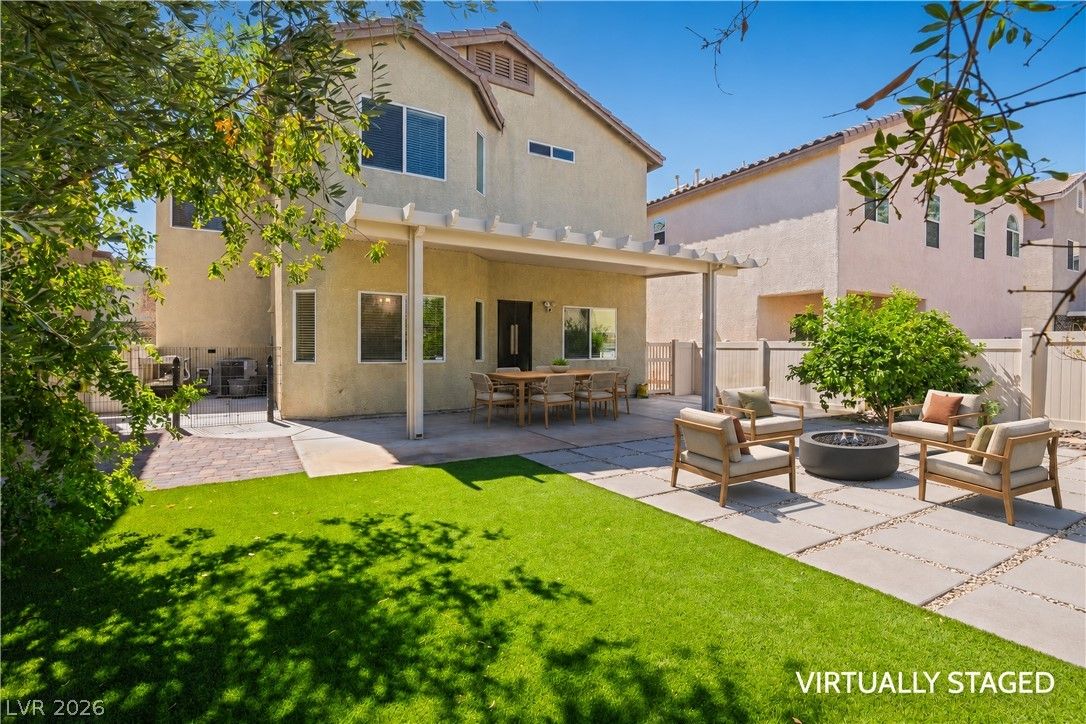
2204 Spartan View CourtActive
$467,0003 bd3 ba1,866 sqft$250/sqft0.52 mi14 days
Nearest comparable sales and listings
12 comparables · median price $447,000 · range $419,000 – $529,999 · median $/sq ft $229 · average $/sq ft $234
| Address | Status | Price | $/Sq Ft | Bd / Ba | Sq Ft | Sold / market time | Distance |
|---|---|---|---|---|---|---|---|
| 8837 Red Fox Drive | Sold | $425,000 | $207 | 4 / 3 | 2,054 | Sold 2026-05-12 | 0.04 mi |
| 1695 Little Crow Avenue | Sold | $465,000 | $204 | 3 / 3 | 2,274 | Sold 2026-05-07 | 0.05 mi |
| 8838 Red Raven Court | Sold | $455,000 | $200 | 3 / 3 | 2,274 | Sold 2026-08-28 | 0.09 mi |
| 1755 Little Crow Avenue | Sold | $454,000 | $200 | 3 / 3 | 2,274 | Sold 2026-08-31 | 0.10 mi |
| 1810 Pebble Cove Avenue | Active | $419,000 | $264 | 4 / 2 | 1,588 | 39 days on market | 0.25 mi |
| 1820 Pebble Cove Avenue | Sold | $425,000 | $269 | 3 / 2 | 1,582 | Sold 2026-09-30 | 0.26 mi |
| 8859 Keywood Street | Active | $495,000 | $255 | 4 / 3 | 1,942 | 52 days on market | 0.46 mi |
| 8455 Belmont Valley Street | Sold | $430,000 | $216 | 4 / 3 | 1,994 | Sold 2026-09-03 | 0.46 mi |
| 1149 Coral Desert Drive | Active | $529,999 | $288 | 3 / 2 | 1,841 | 0 days on market | 0.47 mi |
| 2204 Spartan View Court | Active | $467,000 | $250 | 3 / 3 | 1,866 | 14 days on market | 0.52 mi |
| 2185 Haypenny Court | Pending | $425,000 | $228 | 3 / 3 | 1,866 | 3 days on market | 0.52 mi |
| 8686 West Treasure Trove | Sold | $440,000 | $231 | 4 / 3 | 1,907 | Sold 2026-09-17 | 0.53 mi |


