
Comparable Sales Near 7100 Alamosa Way, Las Vegas, NV 89128
1st Realty · Comparable sales report · 1st.estate · October 20, 2026
Browse our Las Vegas area guides →
7100 Alamosa Way, Las Vegas, NV 89128
Status: Sold
$440,000 Sold Price
$260
$ / Sq Ft
1,691
Living Area
6,098 sqft
Lot Size
4
Beds
2
Baths
1979
Year Built
Search Parameters
Property Type
Status
Radius
Sold Within
Beds
Baths
Living Area (Sq Ft)
Lot Size (Sq Ft)
This comp search reflects your current search parameters — adjust the filters above as needed for a more accurate estimate.
Estimated Value
—
Average $/Sqft
—
Check one or more comps below to calculate an estimate.
Nearest 10 of 50 comparable sales and listings within 1 mile of this home. Use the filters above and press Search to refine.
1108 Pagosa WaySold
$480,0003 bd2 ba1,699 sqft$283/sqft0.14 mi34 daysSold 2026-07-20
$368,0003 bd2 ba1,508 sqft$244/sqft0.28 mi47 daysSold 2026-05-27

1001 Transom DriveActive
$400,0003 bd2 ba1,378 sqft$290/sqft0.32 mi147 days
$310,0003 bd3 ba1,552 sqft$200/sqft0.33 mi7 daysSold 2026-06-12
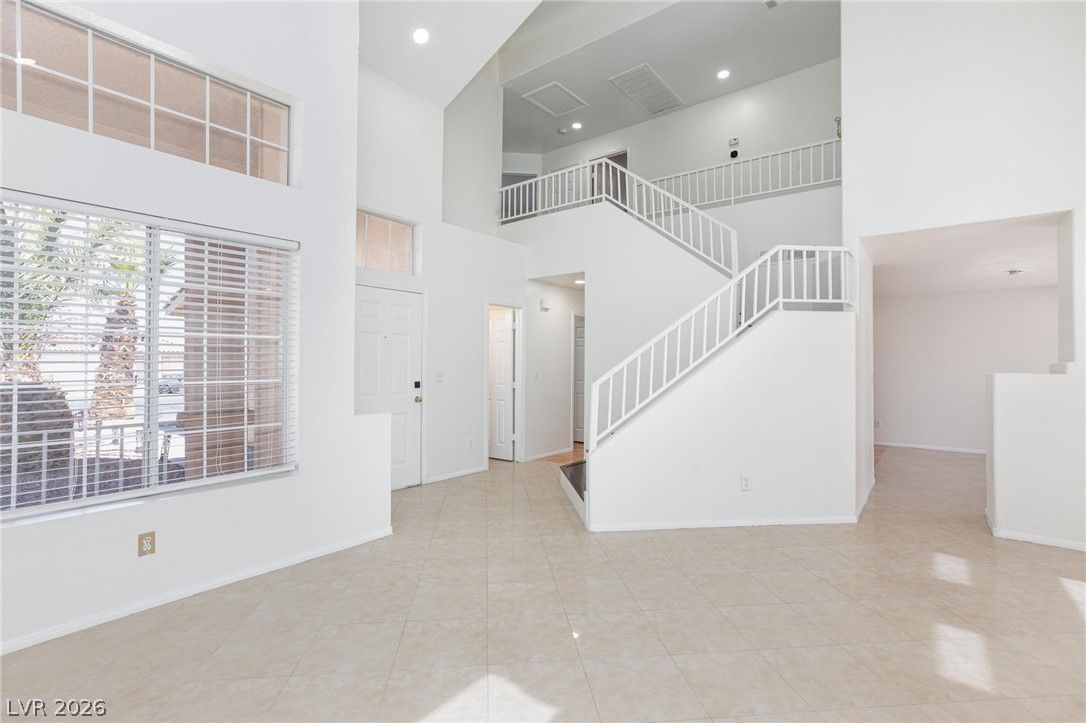
7313 Silver Ridge DriveActive
$449,0003 bd2 ba1,487 sqft$302/sqft0.34 mi39 days
1209 Nugget Creek DriveActive
$413,0003 bd3 ba1,500 sqft$275/sqft0.38 mi0 days
$435,0003 bd2 ba1,508 sqft$288/sqft0.38 mi8 daysSold 2026-07-07
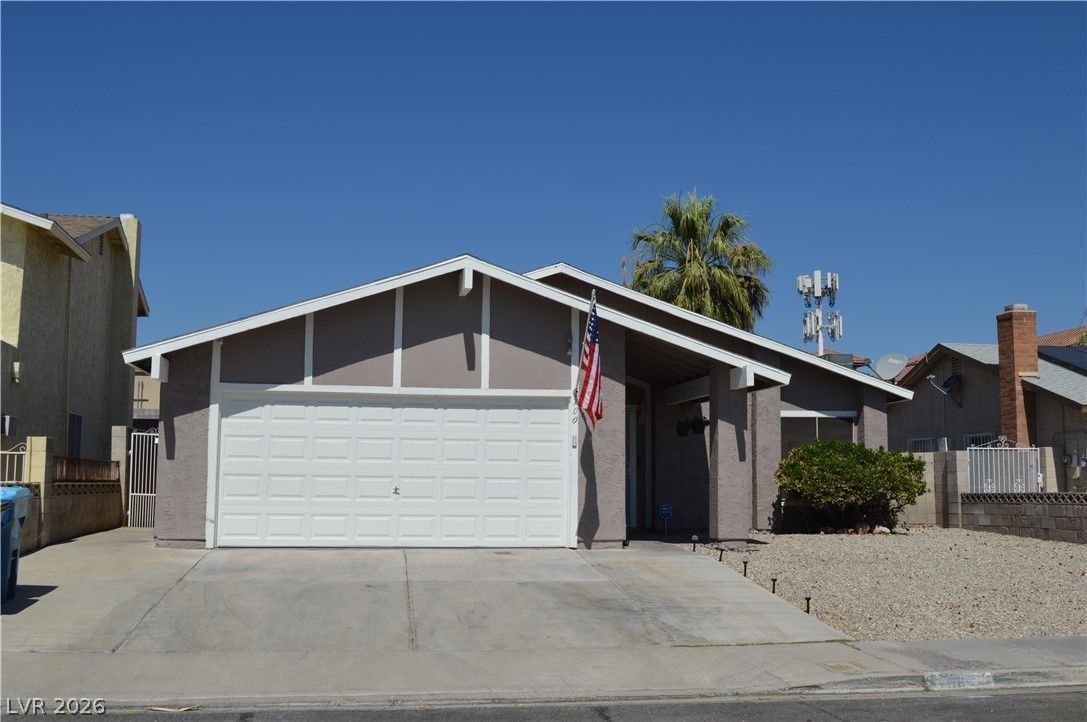
$406,0004 bd2 ba1,533 sqft$265/sqft0.45 mi2 daysSold 2026-07-31
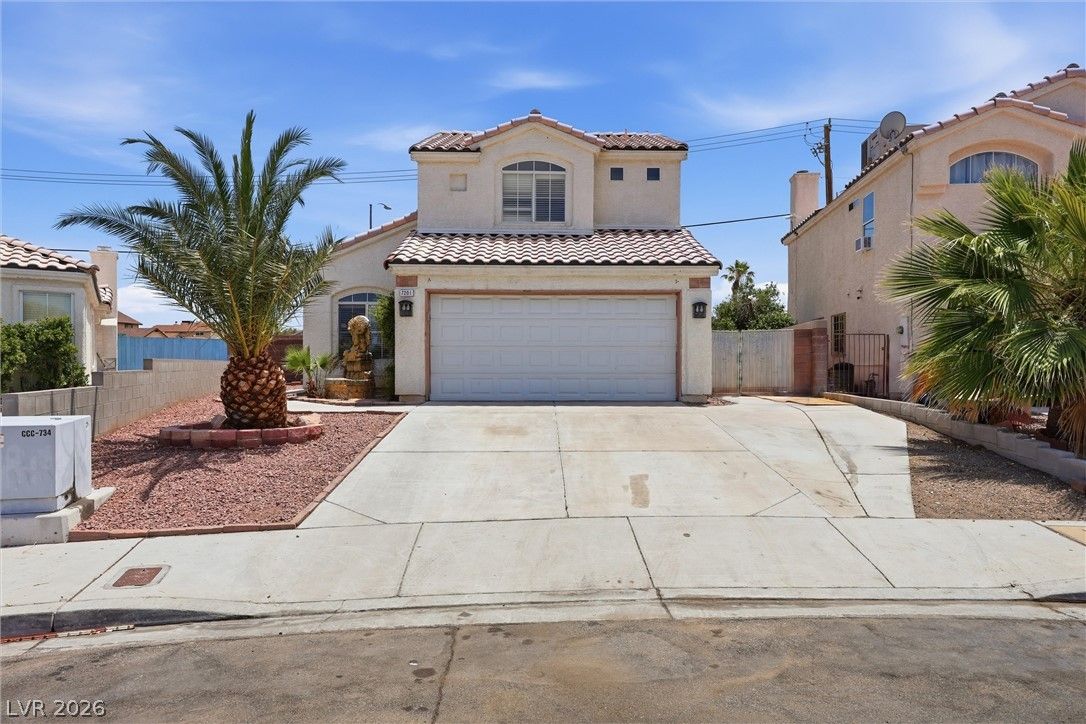
$415,0004 bd3 ba1,966 sqft$211/sqft0.46 mi21 daysSold 2026-08-14
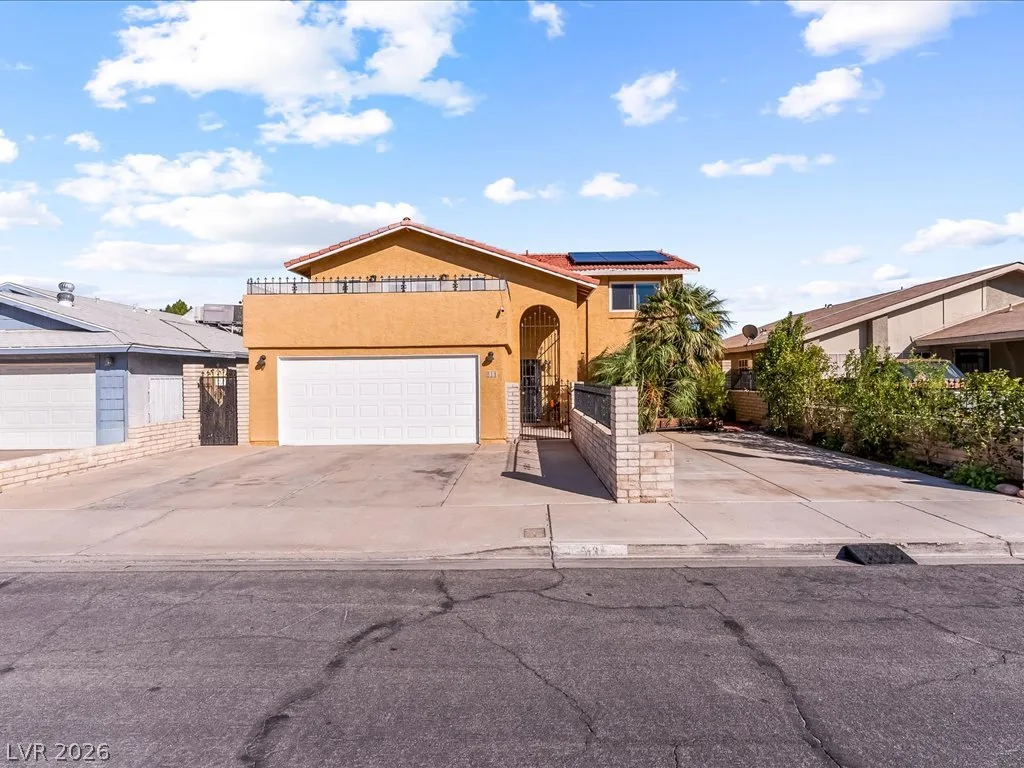
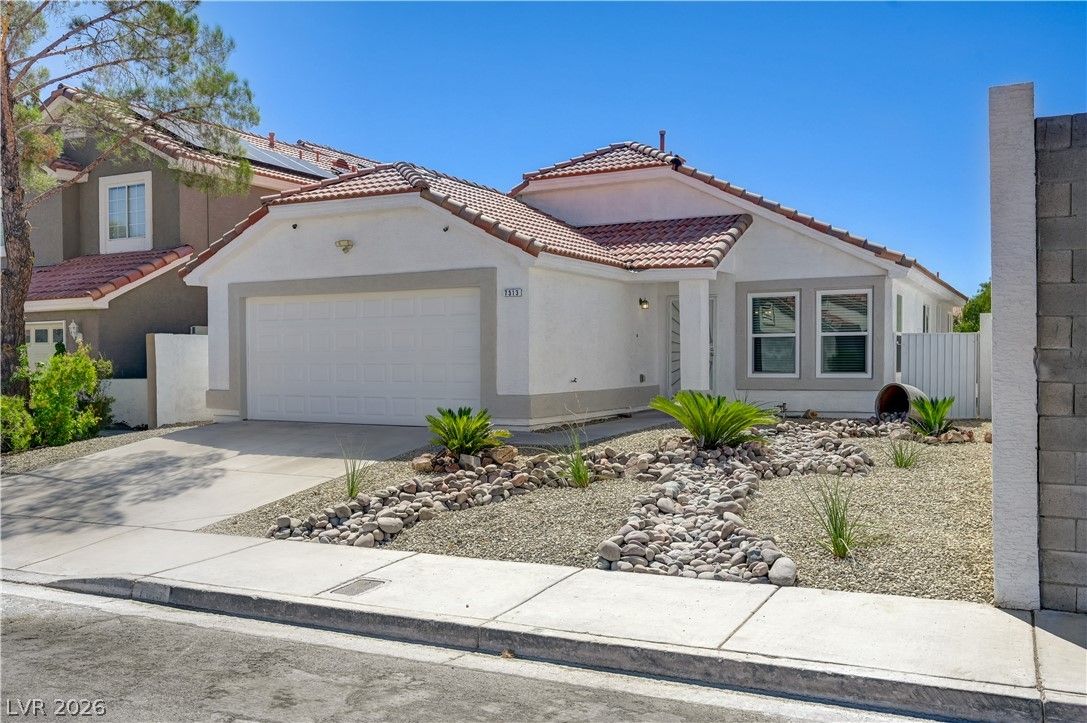
513 Dolores DriveActive
$450,0003 bd3 ba1,920 sqft$234/sqft0.50 mi3 days
Nearest comparable sales and listings
12 comparables · median price $414,000 · range $310,000 – $480,000 · median $/sq ft $275 · average $/sq ft $264
| Address | Status | Price | $/Sq Ft | Bd / Ba | Sq Ft | Sold / market time | Distance |
|---|---|---|---|---|---|---|---|
| 1108 Pagosa Way | Sold | $480,000 | $283 | 3 / 2 | 1,699 | Sold 2026-07-20 | 0.14 mi |
| 1312 Wheatland Way | Sold | $368,000 | $244 | 3 / 2 | 1,508 | Sold 2026-05-27 | 0.28 mi |
| 1001 Transom Drive | Active | $400,000 | $290 | 3 / 2 | 1,378 | 147 days on market | 0.32 mi |
| 7045 Brown Derby Circle | Sold | $310,000 | $200 | 3 / 3 | 1,552 | Sold 2026-06-12 | 0.33 mi |
| 7313 Silver Ridge Drive | Active | $449,000 | $302 | 3 / 2 | 1,487 | 39 days on market | 0.34 mi |
| 1209 Nugget Creek Drive | Active | $413,000 | $275 | 3 / 3 | 1,500 | 0 days on market | 0.38 mi |
| 1500 Wheatland Way | Sold | $435,000 | $288 | 3 / 2 | 1,508 | Sold 2026-07-07 | 0.38 mi |
| 700 Dolores Drive | Sold | $406,000 | $265 | 4 / 2 | 1,533 | Sold 2026-07-31 | 0.45 mi |
| 7201 Single Pine Drive | Sold | $415,000 | $211 | 4 / 3 | 1,966 | Sold 2026-08-14 | 0.46 mi |
| 513 Dolores Drive | Active | $450,000 | $234 | 3 / 3 | 1,920 | 3 days on market | 0.50 mi |
| 7432 Saybrook Point Drive | Active | $380,000 | $299 | 3 / 2 | 1,273 | 84 days on market | 0.55 mi |
| 516 Purcell Drive | Sold | $420,000 | $274 | 3 / 2 | 1,533 | Sold 2026-05-28 | 0.56 mi |


