
Comparable Sales Near 7407 Dragonfruit Avenue, Las Vegas, NV 89113
1st Realty · Comparable sales report · 1st.estate · October 20, 2026
Read the Enterprise neighborhood guide →
7407 Dragonfruit Avenue, Las Vegas, NV 89113
Status: Sold
$2,100 Sold Price
$1
$ / Sq Ft
1,714
Living Area
3,485 sqft
Lot Size
3
Beds
3
Baths
2023
Year Built
Search Parameters
Property Type
Status
Radius
Sold Within
Beds
Baths
Living Area (Sq Ft)
Lot Size (Sq Ft)
This comp search reflects your current search parameters — adjust the filters above as needed for a more accurate estimate.
Estimated Value
—
Average $/Sqft
—
Check one or more comps below to calculate an estimate.
Nearest 10 of 31 comparable sales and listings within 1 mile of this home. Use the filters above and press Search to refine.
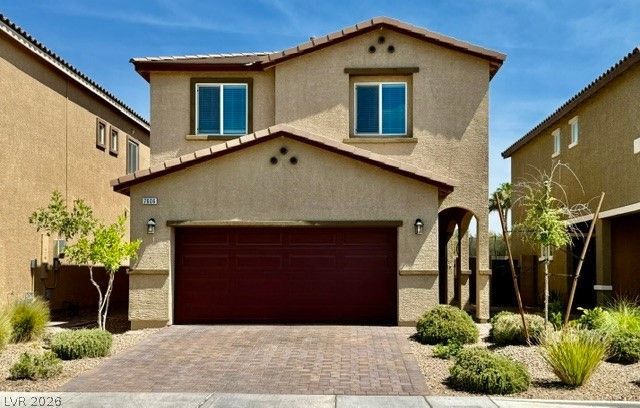
$480,0004 bd3 ba1,796 sqft$267/sqft0.17 mi134 daysSold 2026-05-12
7606 Red Plumeria AvenueUnder Contract
$460,0003 bd3 ba1,714 sqft$268/sqft0.24 mi124 days
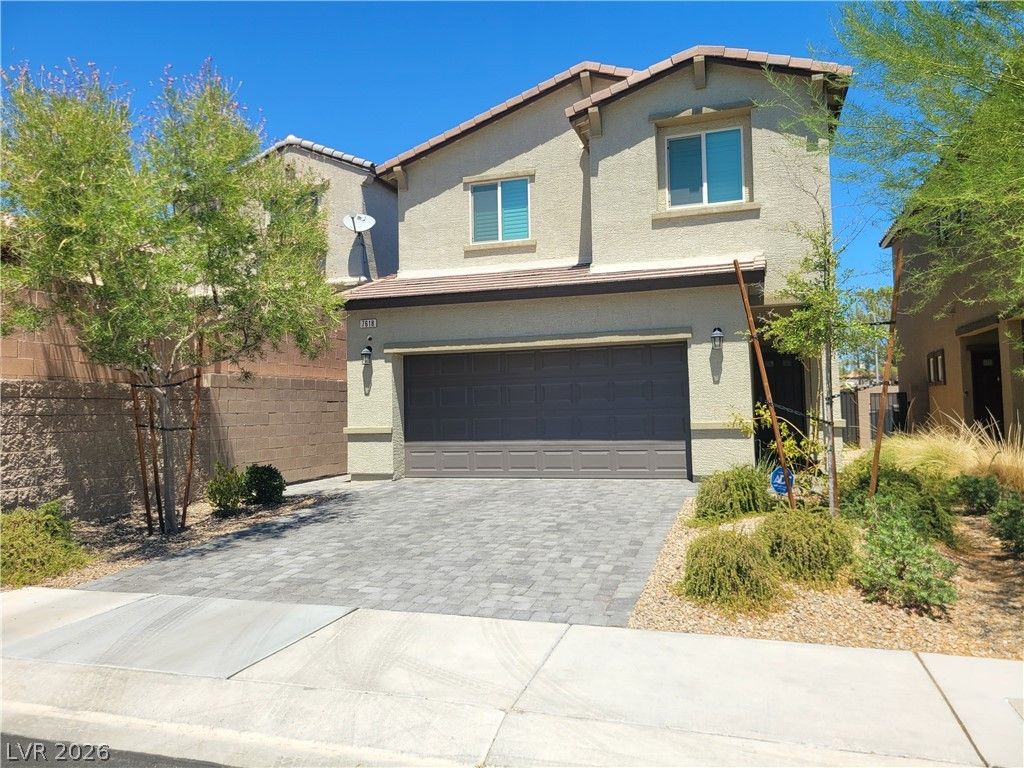
$500,0004 bd3 ba1,796 sqft$278/sqft0.25 mi16 daysSold 2026-09-10
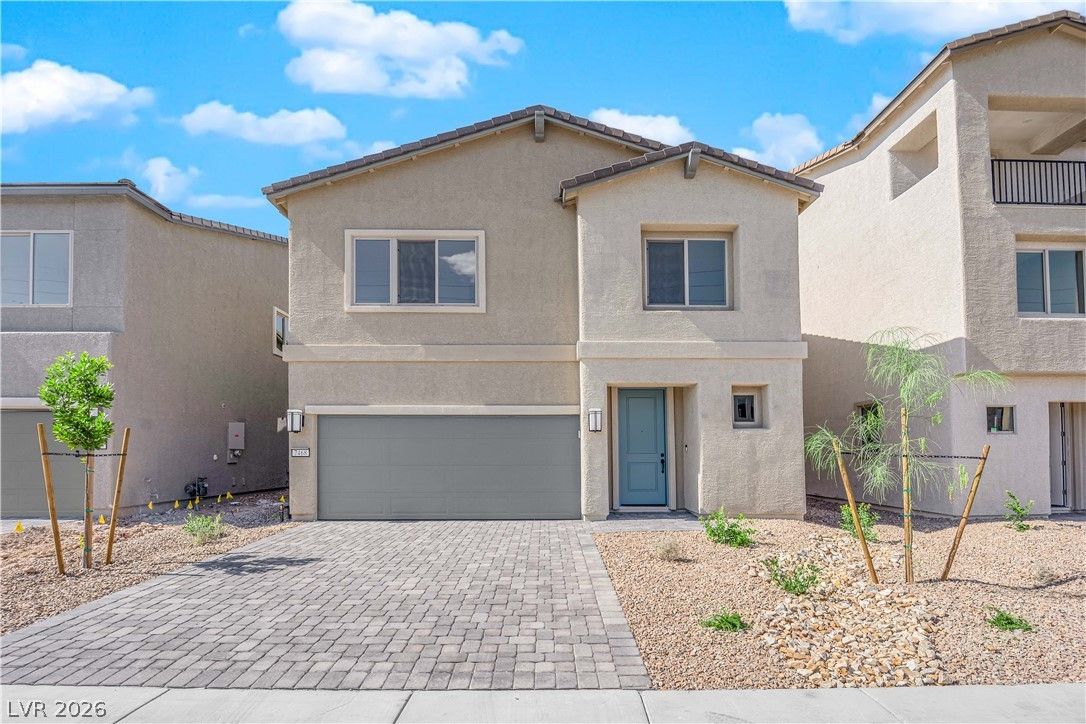
7468 Delemont AvenueActive
$538,0003 bd3 ba2,034 sqft$265/sqft0.34 mi81 days
$450,0003 bd3 ba1,588 sqft$283/sqft0.34 mi262 daysSold 2026-06-01
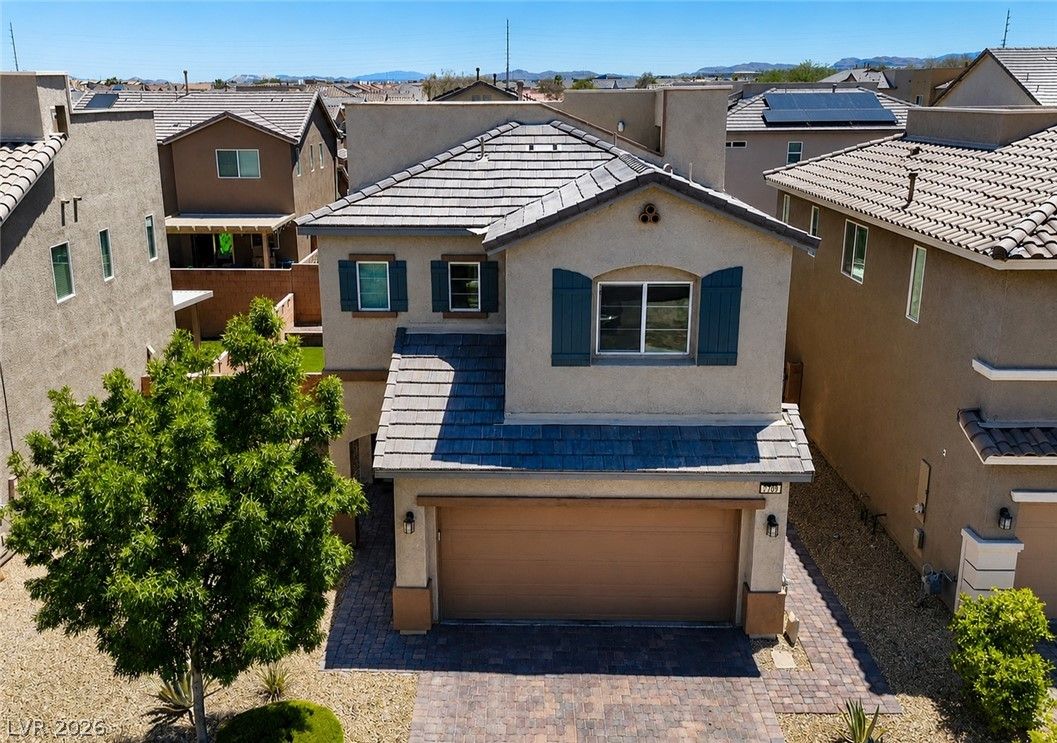
$450,0003 bd3 ba1,622 sqft$277/sqft0.37 mi47 daysSold 2026-08-14
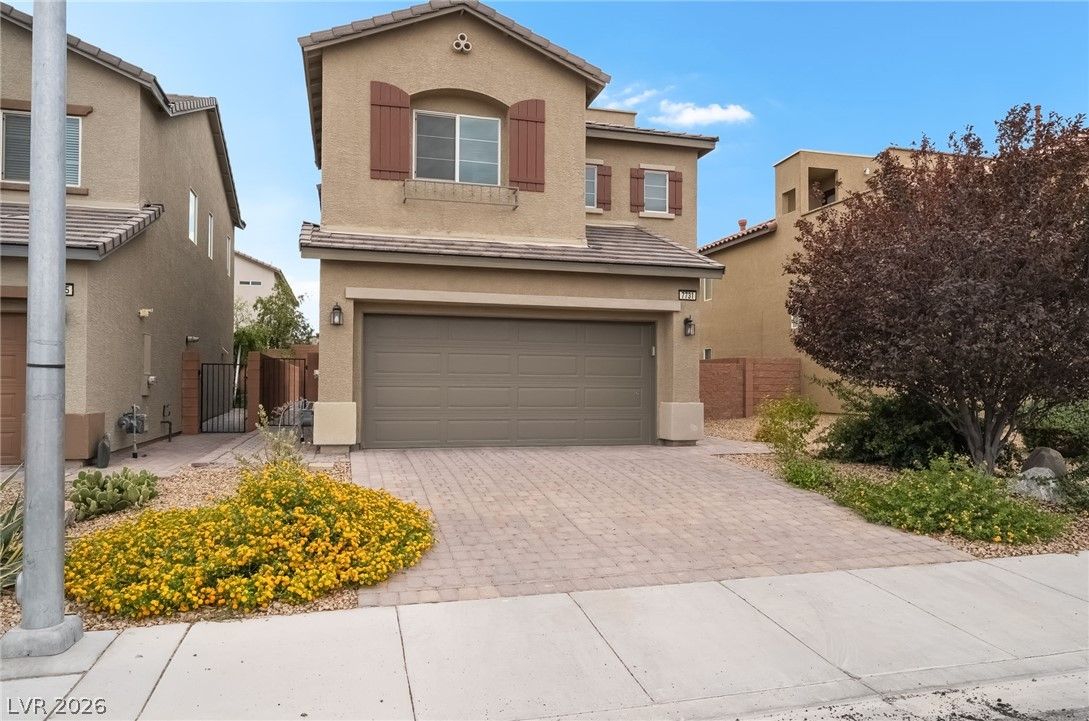
7731 West Diablo DriveActive
$460,0003 bd3 ba1,622 sqft$284/sqft0.38 mi68 days
7044 Somera WaySold
$475,0004 bd3 ba2,127 sqft$223/sqft0.40 mi27 daysSold 2026-06-08
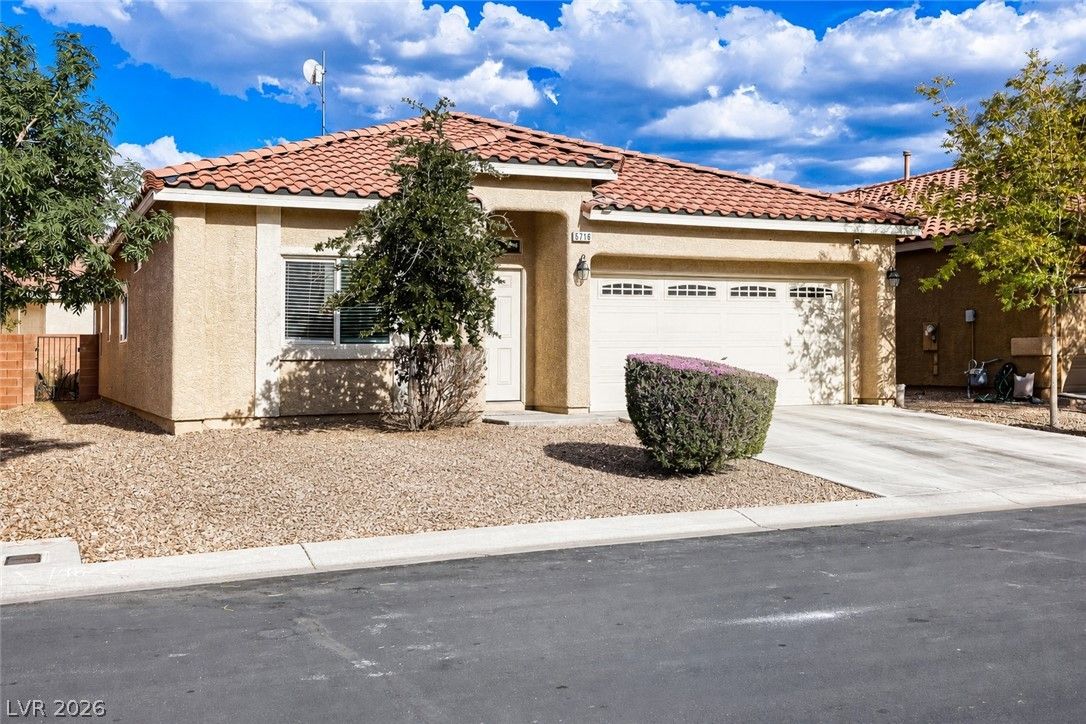
5716 Port Douglas CourtActive
$380,0003 bd2 ba1,566 sqft$243/sqft0.48 mi59 days

7081 Baza AvenueActive
$469,9904 bd3 ba2,118 sqft$222/sqft0.48 mi48 days
Nearest comparable sales and listings
12 comparables · median price $464,995 · range $376,000 – $538,000 · median $/sq ft $266 · average $/sq ft $257
| Address | Status | Price | $/Sq Ft | Bd / Ba | Sq Ft | Sold / market time | Distance |
|---|---|---|---|---|---|---|---|
| 7540 Red Plumeria Avenue | Sold | $480,000 | $267 | 4 / 3 | 1,796 | Sold 2026-05-12 | 0.17 mi |
| 7606 Red Plumeria Avenue | Under Contract | $460,000 | $268 | 3 / 3 | 1,714 | 124 days on market | 0.24 mi |
| 7618 Red Plumeria Avenue | Sold | $500,000 | $278 | 4 / 3 | 1,796 | Sold 2026-09-10 | 0.25 mi |
| 7468 Delemont Avenue | Active | $538,000 | $265 | 3 / 3 | 2,034 | 81 days on market | 0.34 mi |
| 7707 Mocorito Avenue | Sold | $450,000 | $283 | 3 / 3 | 1,588 | Sold 2026-06-01 | 0.34 mi |
| 7709 Pyrenees Park Drive | Sold | $450,000 | $277 | 3 / 3 | 1,622 | Sold 2026-08-14 | 0.37 mi |
| 7731 West Diablo Drive | Active | $460,000 | $284 | 3 / 3 | 1,622 | 68 days on market | 0.38 mi |
| 7044 Somera Way | Sold | $475,000 | $223 | 4 / 3 | 2,127 | Sold 2026-06-08 | 0.40 mi |
| 5716 Port Douglas Court | Active | $380,000 | $243 | 3 / 2 | 1,566 | 59 days on market | 0.48 mi |
| 7081 Baza Avenue | Active | $469,990 | $222 | 4 / 3 | 2,118 | 48 days on market | 0.48 mi |
| 7301 Teagan Avenue | Active | $525,000 | $248 | 4 / 3 | 2,118 | 1 days on market | 0.50 mi |
| 5790 Native Dancer Court | Sold | $376,000 | $221 | 3 / 3 | 1,704 | Sold 2026-06-15 | 0.51 mi |


