
Comparable Sales Near 5816 Marka Drive, Las Vegas, NV 89108
1st Realty · Comparable sales report · 1st.estate · October 20, 2026
Browse our Las Vegas area guides →
5816 Marka Drive, Las Vegas, NV 89108
Status: Sold
$399,999 Sold Price
$240
$ / Sq Ft
1,666
Living Area
6,098 sqft
Lot Size
4
Beds
2
Baths
1963
Year Built
Search Parameters
Property Type
Status
Radius
Sold Within
Beds
Baths
Living Area (Sq Ft)
Lot Size (Sq Ft)
This comp search reflects your current search parameters — adjust the filters above as needed for a more accurate estimate.
Estimated Value
—
Average $/Sqft
—
Check one or more comps below to calculate an estimate.
Nearest 10 of 80 comparable sales and listings within 1 mile of this home. Use the filters above and press Search to refine.
$425,0004 bd3 ba1,452 sqft$293/sqft0.12 mi3 daysSold 2026-06-08
712 Saylor WaySold
$396,4384 bd3 ba1,599 sqft$248/sqft0.16 mi7 daysSold 2026-07-20
1208 Saylor WaySold
$385,0003 bd2 ba1,334 sqft$289/sqft0.18 mi73 daysSold 2026-06-15
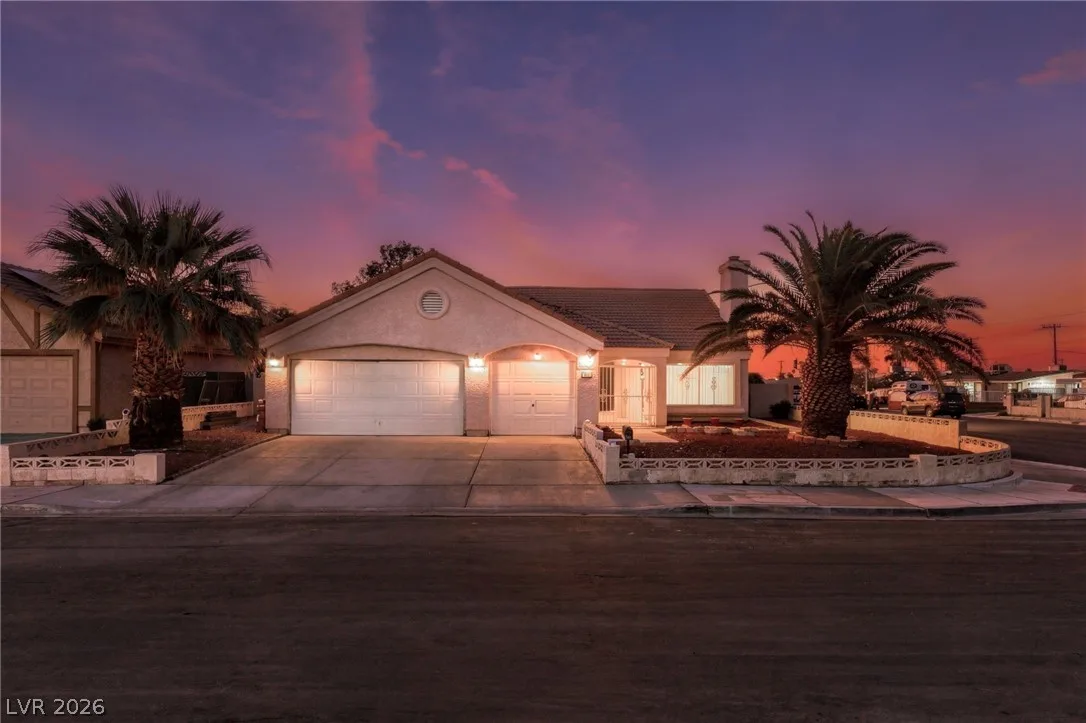
901 Shifting Sands DriveActive
$375,0003 bd2 ba1,520 sqft$247/sqft0.22 mi0 days
$400,0004 bd3 ba1,663 sqft$241/sqft0.32 mi7 daysSold 2026-05-07
$444,9994 bd3 ba1,929 sqft$231/sqft0.32 mi33 daysSold 2026-07-22
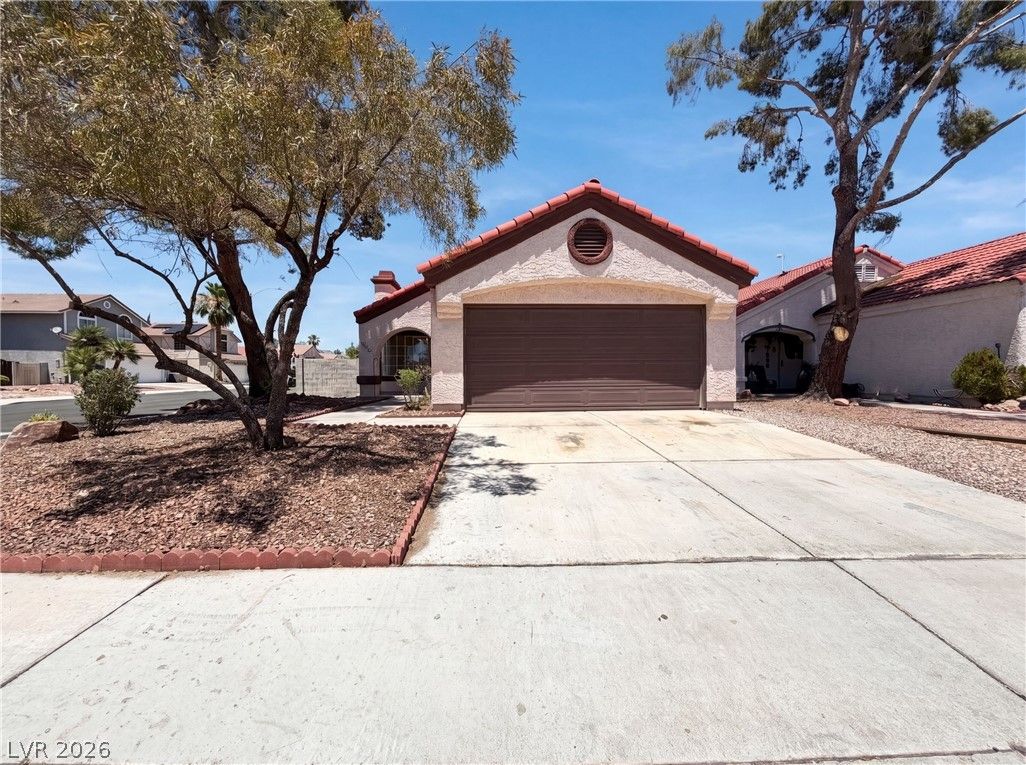
6212 Warm River RoadActive
$385,0003 bd2 ba1,300 sqft$296/sqft0.36 mi73 days
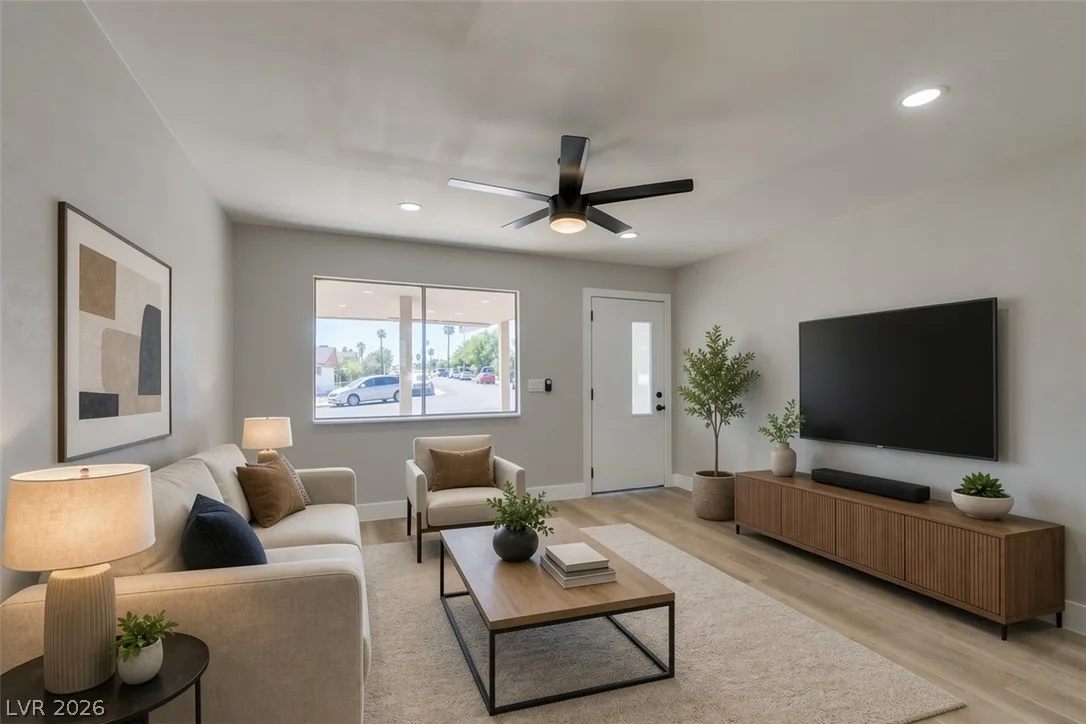
5920 Forrest Hills LaneActive
$369,5004 bd2 ba1,373 sqft$269/sqft0.36 mi0 days
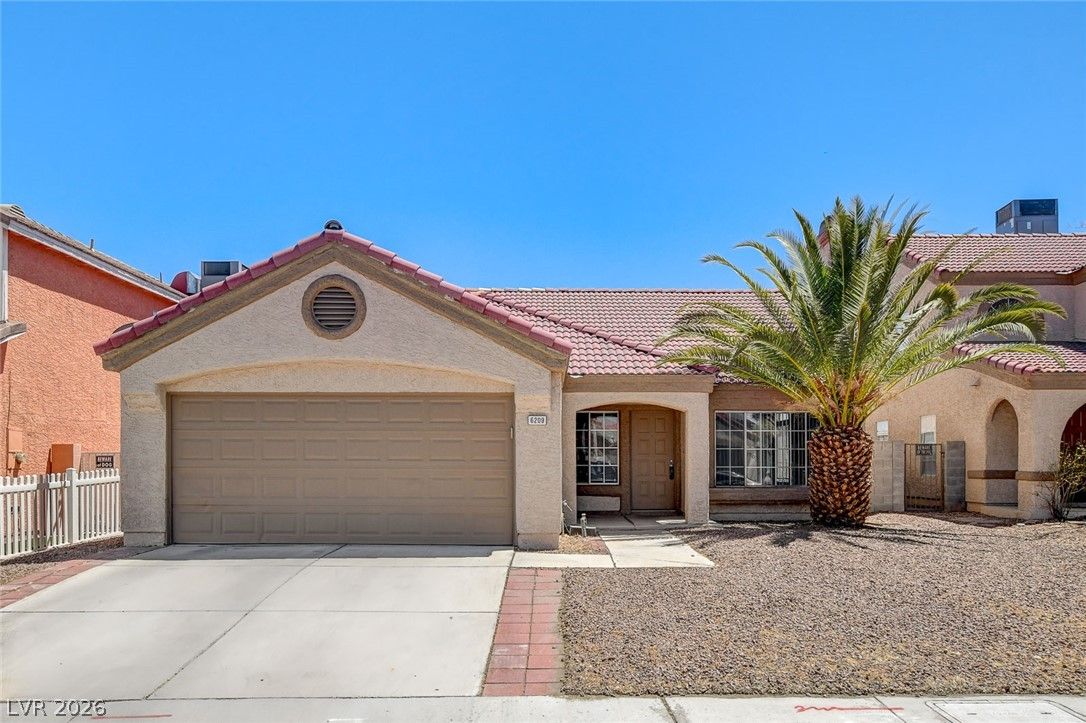
$379,9003 bd2 ba1,520 sqft$250/sqft0.36 mi1 daysSold 2026-07-30
$440,0005 bd3 ba1,642 sqft$268/sqft0.37 mi60 daysSold 2026-04-23
Nearest comparable sales and listings
12 comparables · median price $398,219 · range $369,500 – $444,999 · median $/sq ft $249 · average $/sq ft $256
| Address | Status | Price | $/Sq Ft | Bd / Ba | Sq Ft | Sold / market time | Distance |
|---|---|---|---|---|---|---|---|
| 1017 North Mallard Street | Sold | $425,000 | $293 | 4 / 3 | 1,452 | Sold 2026-06-08 | 0.12 mi |
| 712 Saylor Way | Sold | $396,438 | $248 | 4 / 3 | 1,599 | Sold 2026-07-20 | 0.16 mi |
| 1208 Saylor Way | Sold | $385,000 | $289 | 3 / 2 | 1,334 | Sold 2026-06-15 | 0.18 mi |
| 901 Shifting Sands Drive | Active | $375,000 | $247 | 3 / 2 | 1,520 | 0 days on market | 0.22 mi |
| 704 North Wallace Drive | Sold | $400,000 | $241 | 4 / 3 | 1,663 | Sold 2026-05-07 | 0.32 mi |
| 700 North Wallace Drive | Sold | $444,999 | $231 | 4 / 3 | 1,929 | Sold 2026-07-22 | 0.32 mi |
| 6212 Warm River Road | Active | $385,000 | $296 | 3 / 2 | 1,300 | 73 days on market | 0.36 mi |
| 5920 Forrest Hills Lane | Active | $369,500 | $269 | 4 / 2 | 1,373 | 0 days on market | 0.36 mi |
| 6209 Warm River Road | Sold | $379,900 | $250 | 3 / 2 | 1,520 | Sold 2026-07-30 | 0.36 mi |
| 6205 Carmen Boulevard | Sold | $440,000 | $268 | 5 / 3 | 1,642 | Sold 2026-04-23 | 0.37 mi |
| 5809 Pebble Beach Boulevard | Sold | $420,000 | $237 | 4 / 2 | 1,775 | Sold 2026-05-15 | 0.37 mi |
| 233 Kipling Street | Sold | $429,000 | $210 | 4 / 3 | 2,040 | Sold 2026-05-29 | 0.39 mi |


