
Comparable Sales Near 2819 Beaconfalls Way, Las Vegas, NV 89142
1st Realty · Comparable sales report · 1st.estate · October 21, 2026
Browse our Las Vegas area guides →
2819 Beaconfalls Way, Las Vegas, NV 89142
Status: Sold
$410,000 Sold Price
$247
$ / Sq Ft
1,657
Living Area
3,485 sqft
Lot Size
4
Beds
3
Baths
1987
Year Built
Search Parameters
Property Type
Status
Radius
Sold Within
Beds
Baths
Living Area (Sq Ft)
Lot Size (Sq Ft)
This comp search reflects your current search parameters — adjust the filters above as needed for a more accurate estimate.
Estimated Value
—
Average $/Sqft
—
Check one or more comps below to calculate an estimate.
Nearest 10 of 15 comparable sales and listings within 1 mile of this home. Use the filters above and press Search to refine.

2793 Sandyfalls WayActive
$379,0003 bd2 ba1,277 sqft$297/sqft0.06 mi11 days
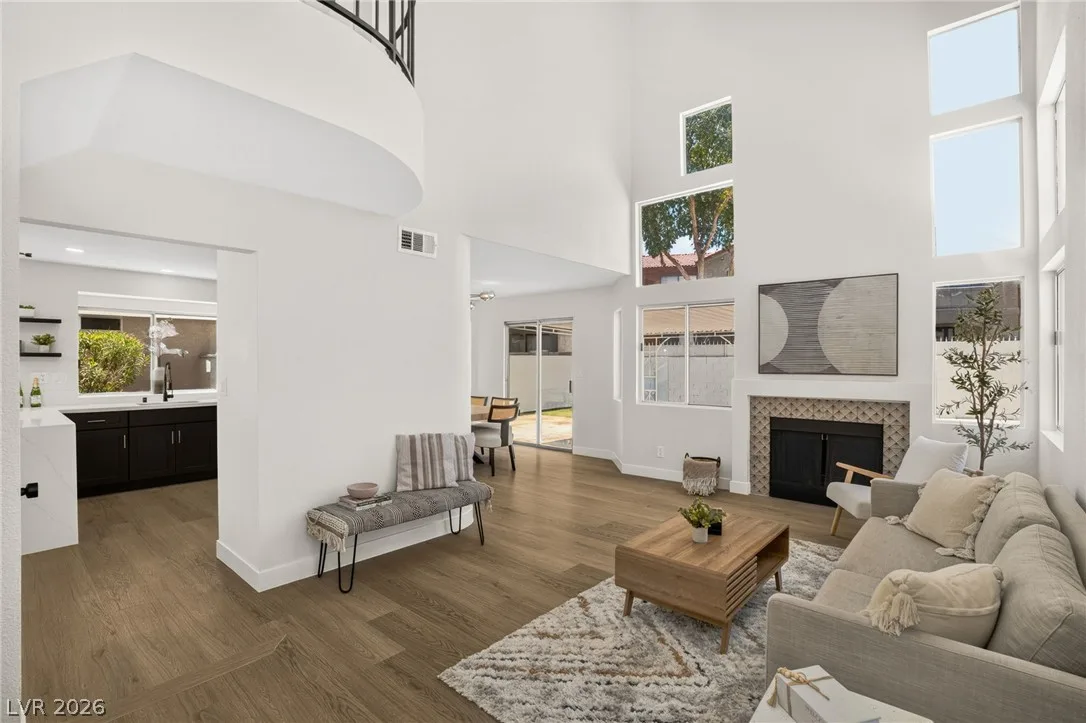
2681 Rungsted StreetActive
$395,0003 bd3 ba1,609 sqft$245/sqft0.17 mi16 days
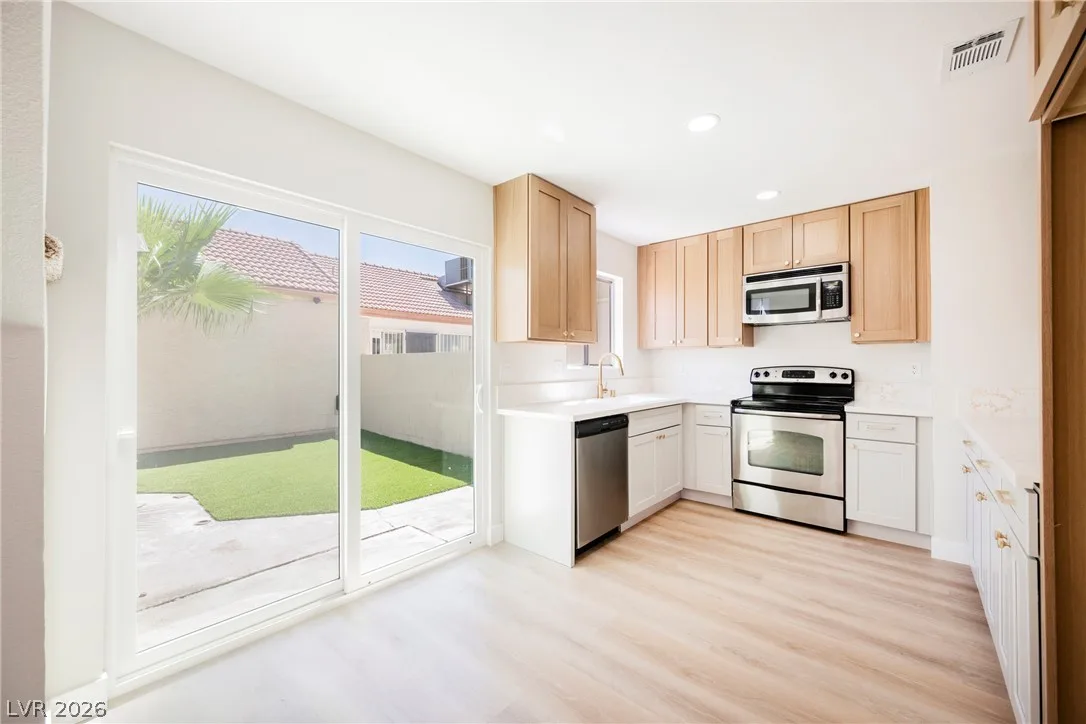
$350,0004 bd2 ba1,322 sqft$265/sqft0.26 mi1 daysSold 2026-10-19
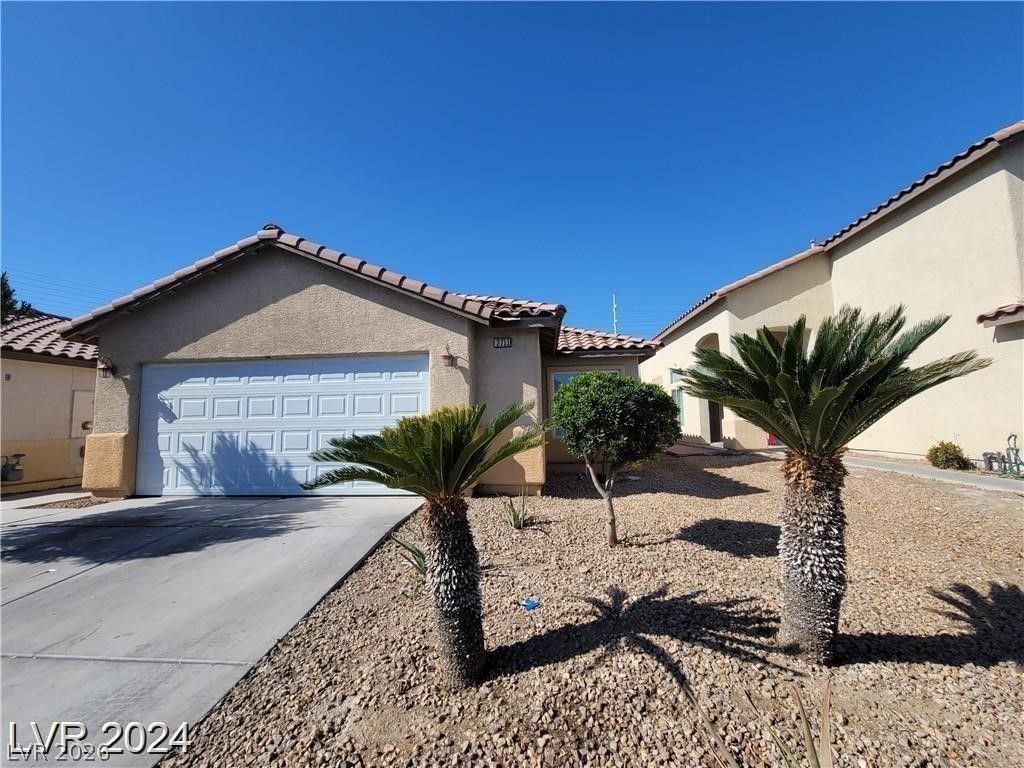
2711 Morning Break CourtActive
$394,9003 bd2 ba1,334 sqft$296/sqft0.64 mi0 days

5883 Glory Canyon WayActive
$440,0005 bd3 ba1,886 sqft$233/sqft0.74 mi26 days
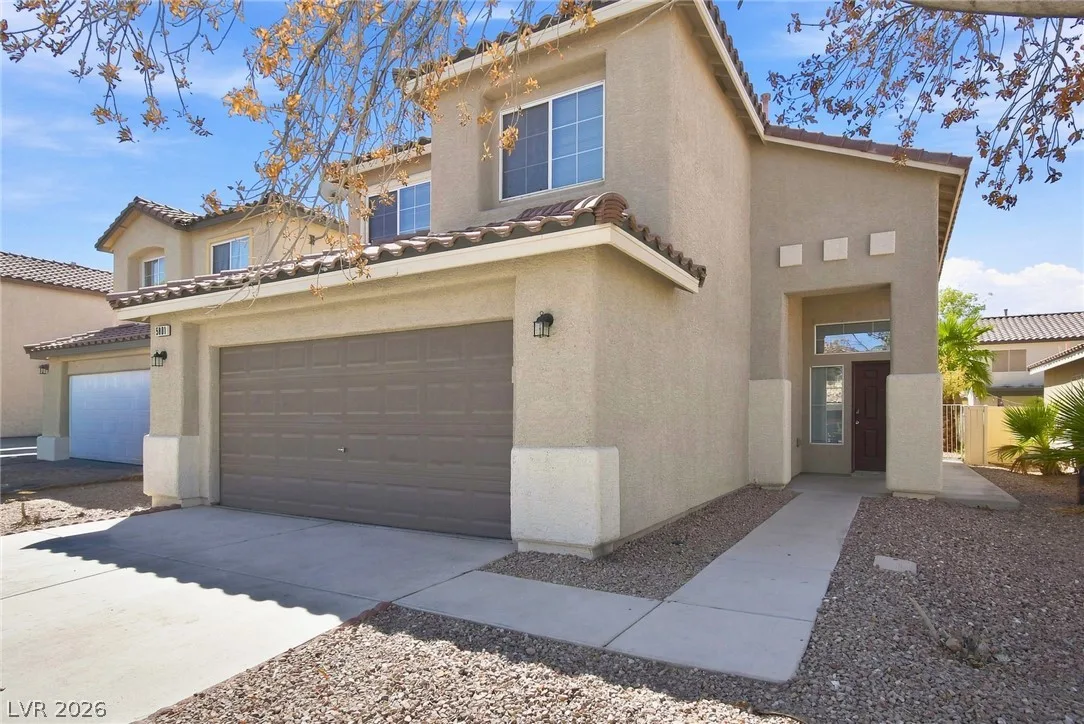
$374,3003 bd3 ba1,637 sqft$229/sqft0.76 mi16 days
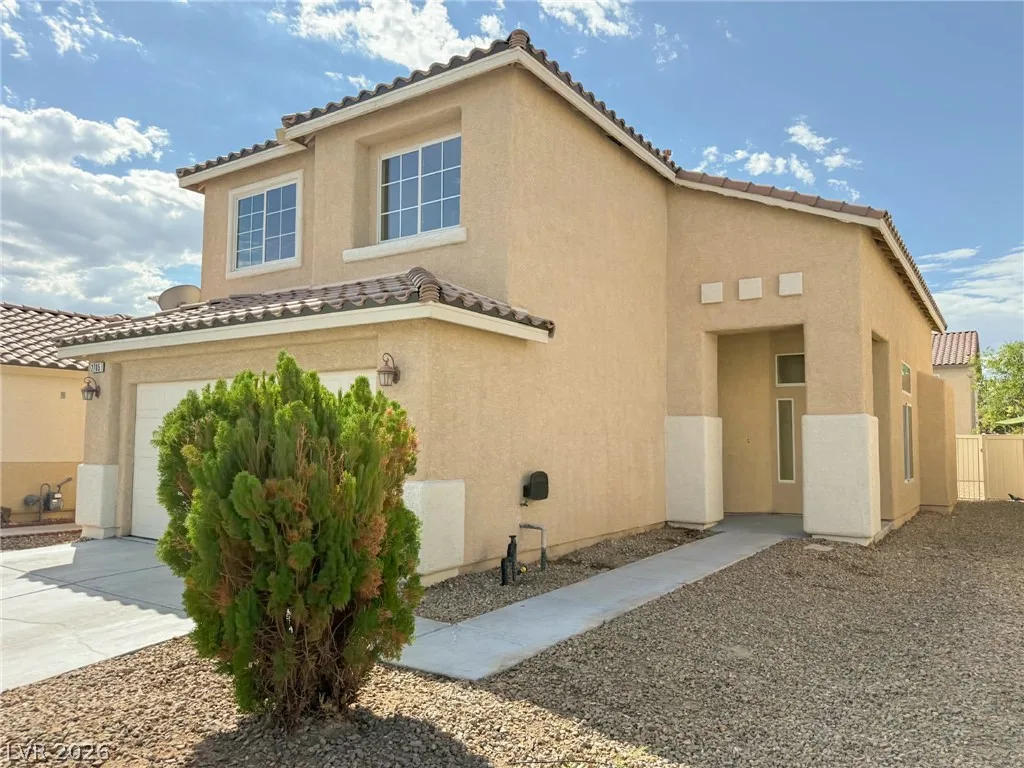
2705 Mossy Oaks LaneActive
$429,9005 bd3 ba1,886 sqft$228/sqft0.78 mi2 days
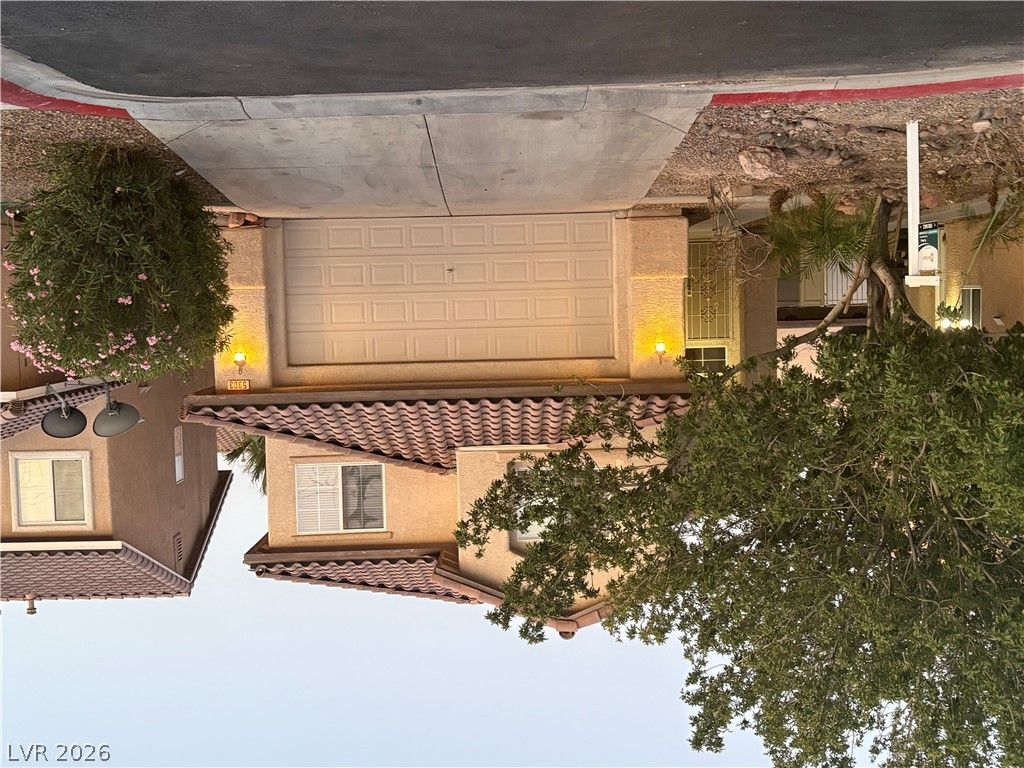
$372,0003 bd3 ba1,637 sqft$227/sqft0.79 mi71 daysSold 2026-09-25
$379,0004 bd3 ba1,594 sqft$238/sqft0.84 mi82 daysSold 2026-05-04
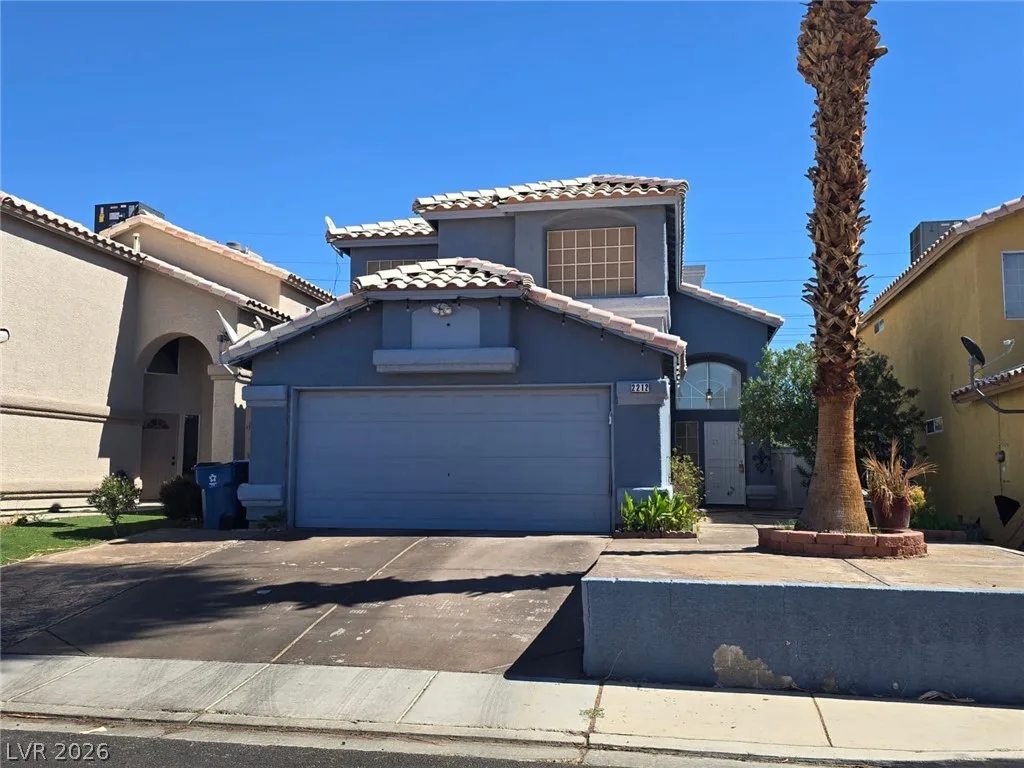
2212 Crowley WayActive
$415,0004 bd3 ba1,636 sqft$254/sqft0.86 mi1 days
Nearest comparable sales and listings
12 comparables · median price $391,950 · range $350,000 – $440,000 · median $/sq ft $242 · average $/sq ft $253
| Address | Status | Price | $/Sq Ft | Bd / Ba | Sq Ft | Sold / market time | Distance |
|---|---|---|---|---|---|---|---|
| 2793 Sandyfalls Way | Active | $379,000 | $297 | 3 / 2 | 1,277 | 11 days on market | 0.06 mi |
| 2681 Rungsted Street | Active | $395,000 | $245 | 3 / 3 | 1,609 | 16 days on market | 0.17 mi |
| 2822 Sesame Drive | Sold | $350,000 | $265 | 4 / 2 | 1,322 | Sold 2026-10-19 | 0.26 mi |
| 2711 Morning Break Court | Active | $394,900 | $296 | 3 / 2 | 1,334 | 0 days on market | 0.64 mi |
| 5883 Glory Canyon Way | Active | $440,000 | $233 | 5 / 3 | 1,886 | 26 days on market | 0.74 mi |
| 5881 Rainbow Bridge Drive | Active | $374,300 | $229 | 3 / 3 | 1,637 | 16 days on market | 0.76 mi |
| 2705 Mossy Oaks Lane | Active | $429,900 | $228 | 5 / 3 | 1,886 | 2 days on market | 0.78 mi |
| 5903 Blue Grouse Trail | Sold | $372,000 | $227 | 3 / 3 | 1,637 | Sold 2026-09-25 | 0.79 mi |
| 5973 Balsam Pine Drive | Sold | $379,000 | $238 | 4 / 3 | 1,594 | Sold 2026-05-04 | 0.84 mi |
| 2212 Crowley Way | Active | $415,000 | $254 | 4 / 3 | 1,636 | 1 days on market | 0.86 mi |
| 5942 Sleepy Fawn Drive | Active | $429,999 | $228 | 4 / 3 | 1,886 | 6 days on market | 0.87 mi |
| 5736 Baffy Circle | Active | $389,000 | $291 | 3 / 2 | 1,338 | 19 days on market | 0.88 mi |


