
Comparable Sales Near 945 Hunter Shores Avenue, North Las Vegas, NV 89084
1st Realty · Comparable sales report · 1st.estate · October 20, 2026
Read the North Las Vegas area guide →
945 Hunter Shores Avenue, North Las Vegas, NV 89084
Status: Sold
$529,950 Sold Price
$215
$ / Sq Ft
2,470
Living Area
3,920 sqft
Lot Size
3
Beds
3
Baths
2025
Year Built
Search Parameters
Property Type
Status
Radius
Sold Within
Beds
Baths
Living Area (Sq Ft)
Lot Size (Sq Ft)
This comp search reflects your current search parameters — adjust the filters above as needed for a more accurate estimate.
Estimated Value
—
Average $/Sqft
—
Check one or more comps below to calculate an estimate.
Nearest 10 of 55 comparable sales and listings within 1 mile of this home. Use the filters above and press Search to refine.
$519,9503 bd3 ba1,858 sqft$280/sqft0.04 mi69 daysSold 2026-05-29
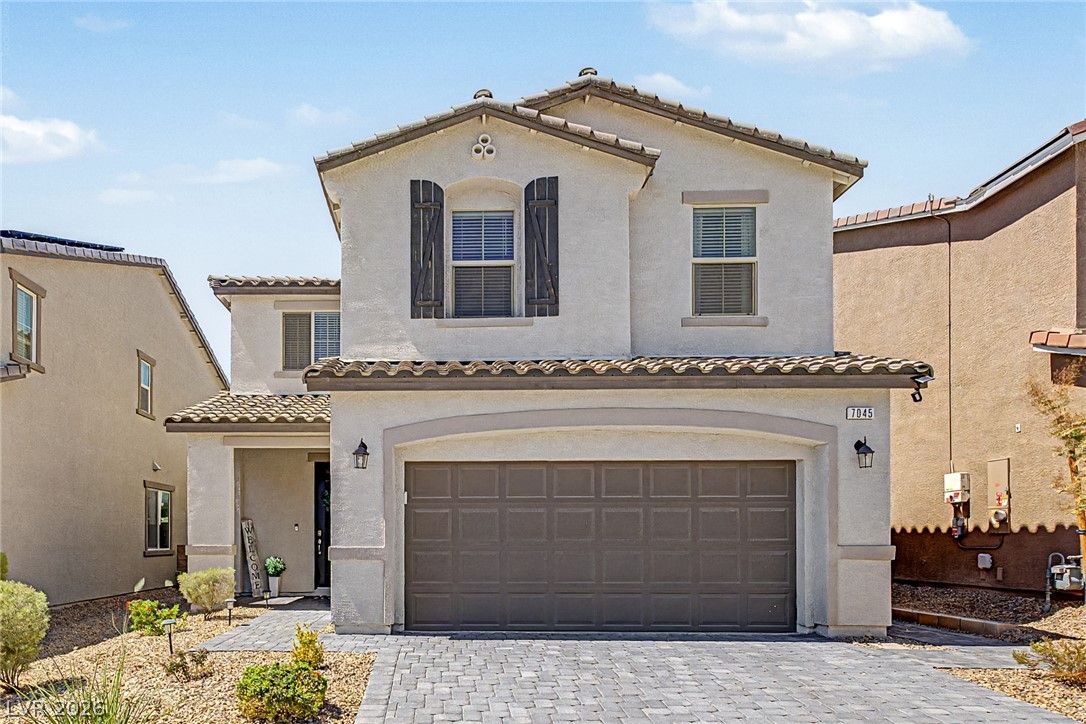
$450,0003 bd3 ba1,858 sqft$242/sqft0.11 mi84 daysSold 2026-05-18
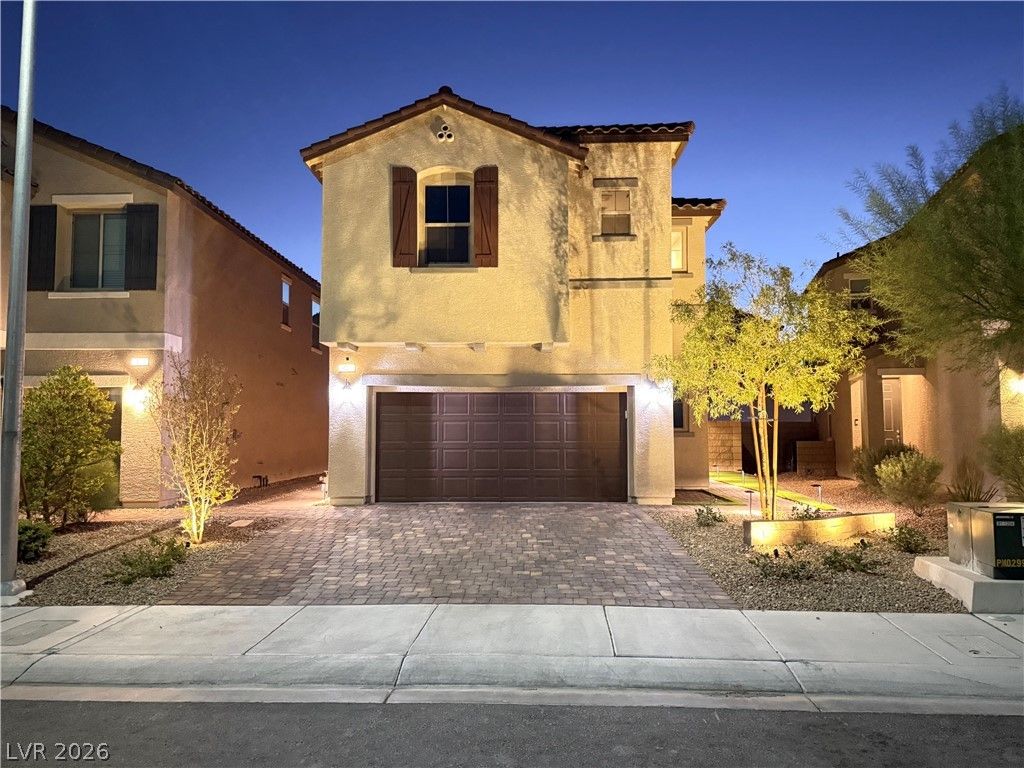
7029 Tilligerry StreetActive
$469,5004 bd3 ba1,858 sqft$253/sqft0.12 mi164 days
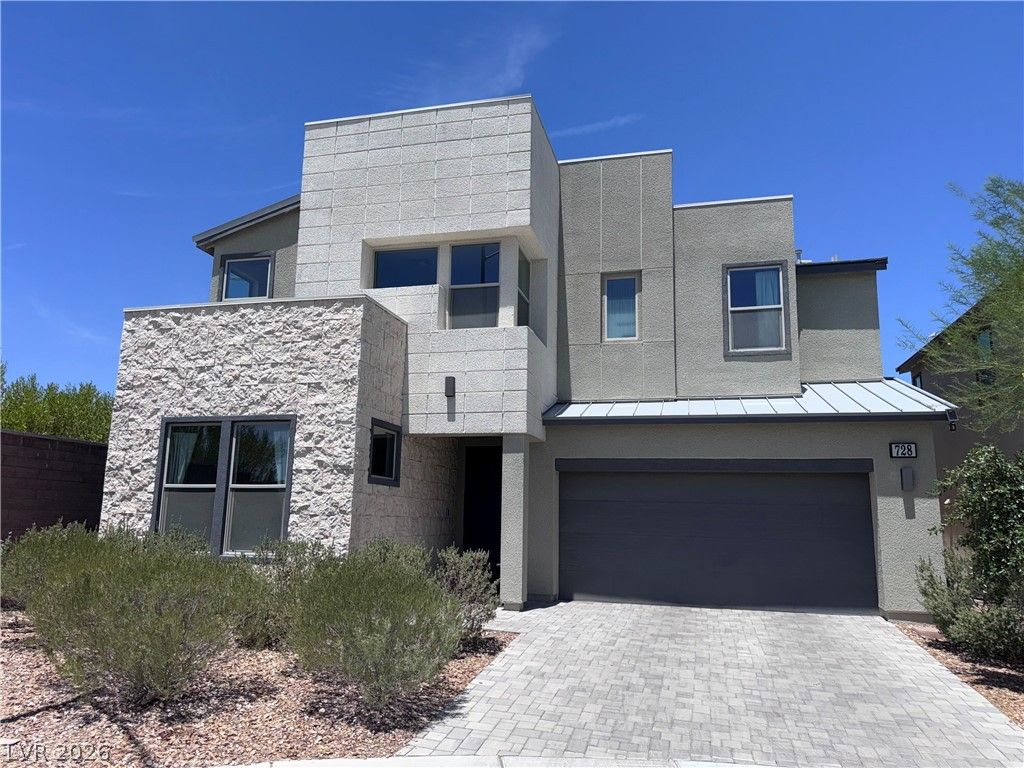
728 Emerson Creek CourtActive
$485,0004 bd3 ba2,648 sqft$183/sqft0.15 mi82 days
$580,0003 bd3 ba2,413 sqft$240/sqft0.16 mi6 days
$510,0004 bd3 ba2,329 sqft$219/sqft0.17 mi17 daysSold 2026-06-30
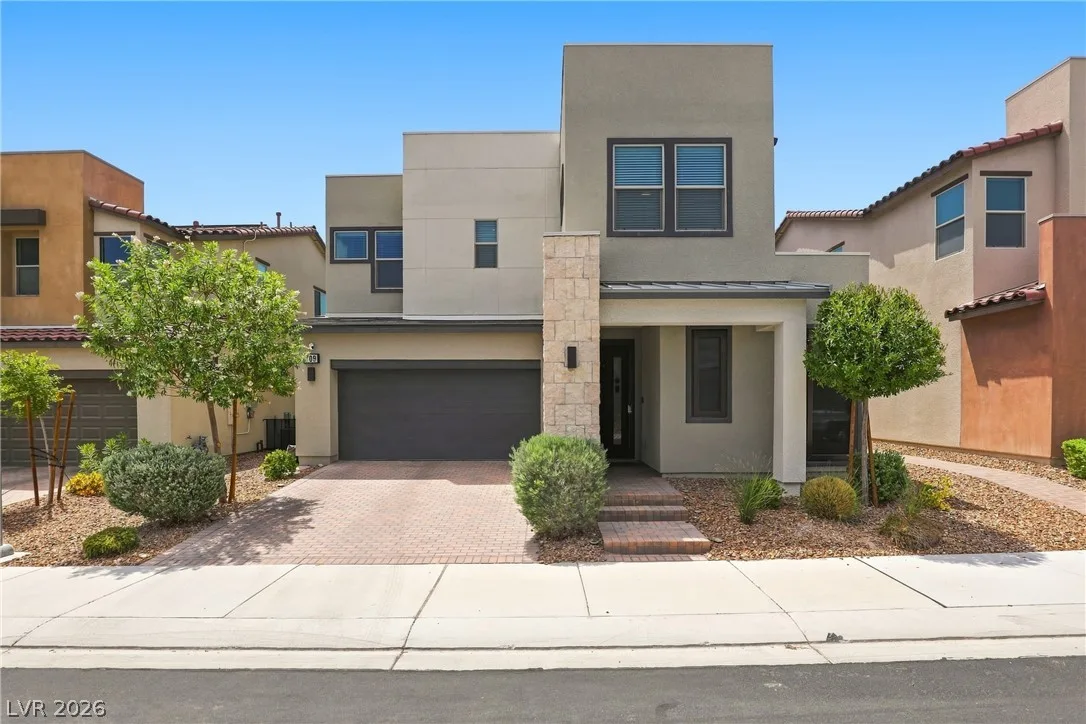
709 Emerson Creek CourtActive
$479,9003 bd3 ba2,415 sqft$199/sqft0.20 mi0 days
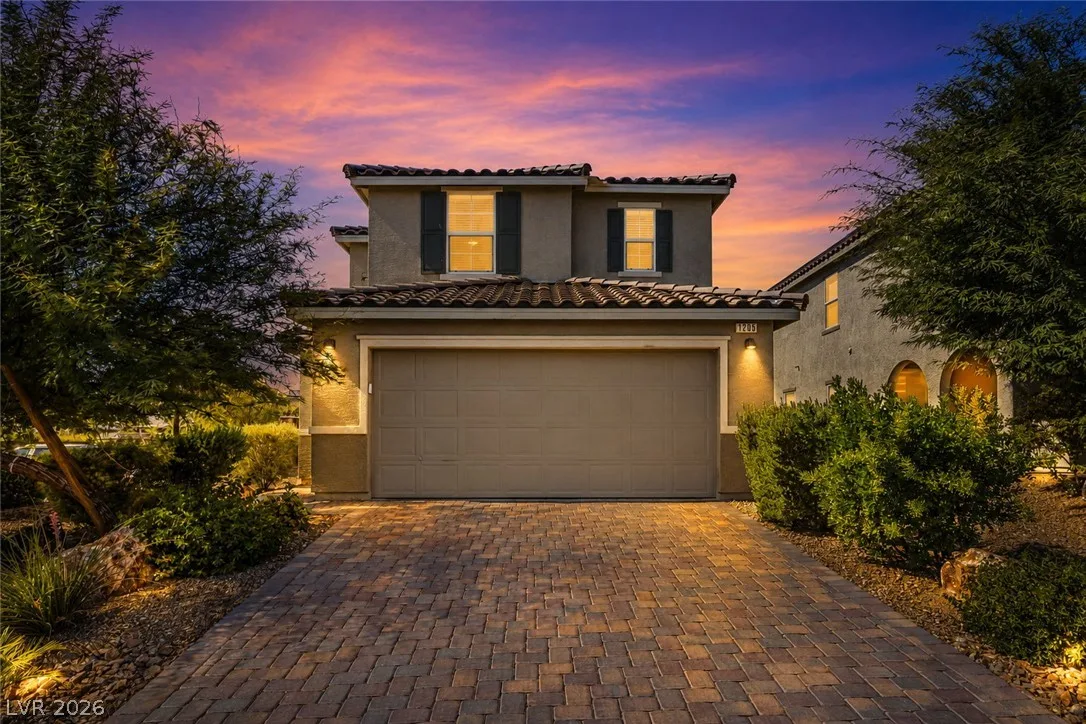
1205 Deep Valley AvenuePending
$400,0003 bd3 ba2,108 sqft$190/sqft0.22 mi0 days
$485,0004 bd3 ba2,462 sqft$197/sqft0.26 mi54 daysSold 2026-05-18
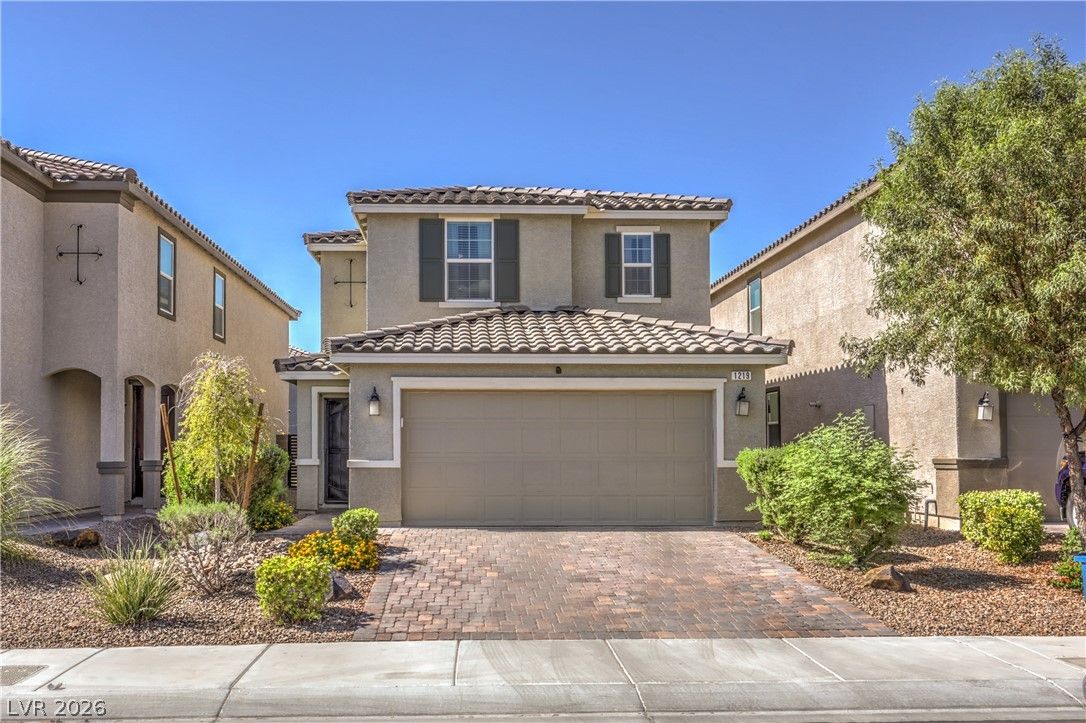
$450,0004 bd3 ba2,108 sqft$213/sqft0.28 mi38 daysSold 2026-10-02
Nearest comparable sales and listings
12 comparables · median price $482,450 · range $400,000 – $580,000 · median $/sq ft $215 · average $/sq ft $220
| Address | Status | Price | $/Sq Ft | Bd / Ba | Sq Ft | Sold / market time | Distance |
|---|---|---|---|---|---|---|---|
| 938 Hunter Shores Avenue | Sold | $519,950 | $280 | 3 / 3 | 1,858 | Sold 2026-05-29 | 0.04 mi |
| 7045 Tilligerry Street | Sold | $450,000 | $242 | 3 / 3 | 1,858 | Sold 2026-05-18 | 0.11 mi |
| 7029 Tilligerry Street | Active | $469,500 | $253 | 4 / 3 | 1,858 | 164 days on market | 0.12 mi |
| 728 Emerson Creek Court | Active | $485,000 | $183 | 4 / 3 | 2,648 | 82 days on market | 0.15 mi |
| 7045 Stockton Dunes Street | Active | $580,000 | $240 | 3 / 3 | 2,413 | 6 days on market | 0.16 mi |
| 7033 Stockton Dunes Street | Sold | $510,000 | $219 | 4 / 3 | 2,329 | Sold 2026-06-30 | 0.17 mi |
| 709 Emerson Creek Court | Active | $479,900 | $199 | 3 / 3 | 2,415 | 0 days on market | 0.20 mi |
| 1205 Deep Valley Avenue | Pending | $400,000 | $190 | 3 / 3 | 2,108 | 0 days on market | 0.22 mi |
| 1237 Deep Valley Avenue | Sold | $485,000 | $197 | 4 / 3 | 2,462 | Sold 2026-05-18 | 0.26 mi |
| 1219 Indigo Bluff Avenue | Sold | $450,000 | $213 | 4 / 3 | 2,108 | Sold 2026-10-02 | 0.28 mi |
| 1243 Indigo Bluff Avenue | Active | $445,000 | $211 | 4 / 3 | 2,108 | 9 days on market | 0.32 mi |
| 508 Monarch Ridge Court | Active | $575,000 | $217 | 4 / 3 | 2,648 | 30 days on market | 0.35 mi |


