
Comparable Sales Near 7139 South Durango Drive 203, Las Vegas, NV 89113
1st Realty · Comparable sales report · 1st.estate · October 20, 2026
Read the Enterprise neighborhood guide →
7139 South Durango Drive 203, Las Vegas, NV 89113
Status: Sold
$1,300 Sold Price
$2
$ / Sq Ft
823
Living Area
28,641 sqft
Lot Size
1
Beds
1
Baths
2003
Year Built
Search Parameters
Property Type
Status
Radius
Sold Within
Beds
Baths
Living Area (Sq Ft)
Lot Size (Sq Ft)
This comp search reflects your current search parameters — adjust the filters above as needed for a more accurate estimate.
Estimated Value
—
Average $/Sqft
—
Check one or more comps below to calculate an estimate.
Nearest 10 of 23 comparable sales and listings within 1 mile of this home. Use the filters above and press Search to refine.
$215,0002 bd2 ba906 sqft$237/sqft0.00 mi65 days
$200,0001 bd1 ba743 sqft$269/sqft0.00 mi44 daysSold 2026-06-18
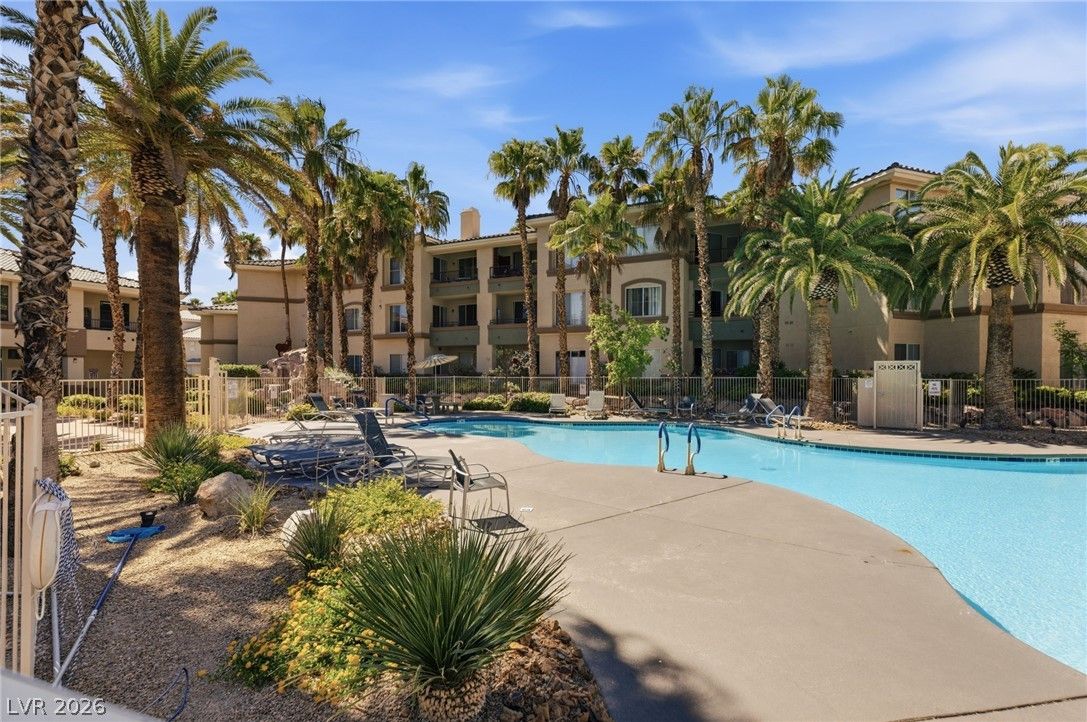
7119 South Durango Drive 105Pending
$230,0002 bd2 ba929 sqft$248/sqft0.03 mi69 days
$175,0001 bd1 ba743 sqft$236/sqft0.03 mi78 daysSold 2026-06-08
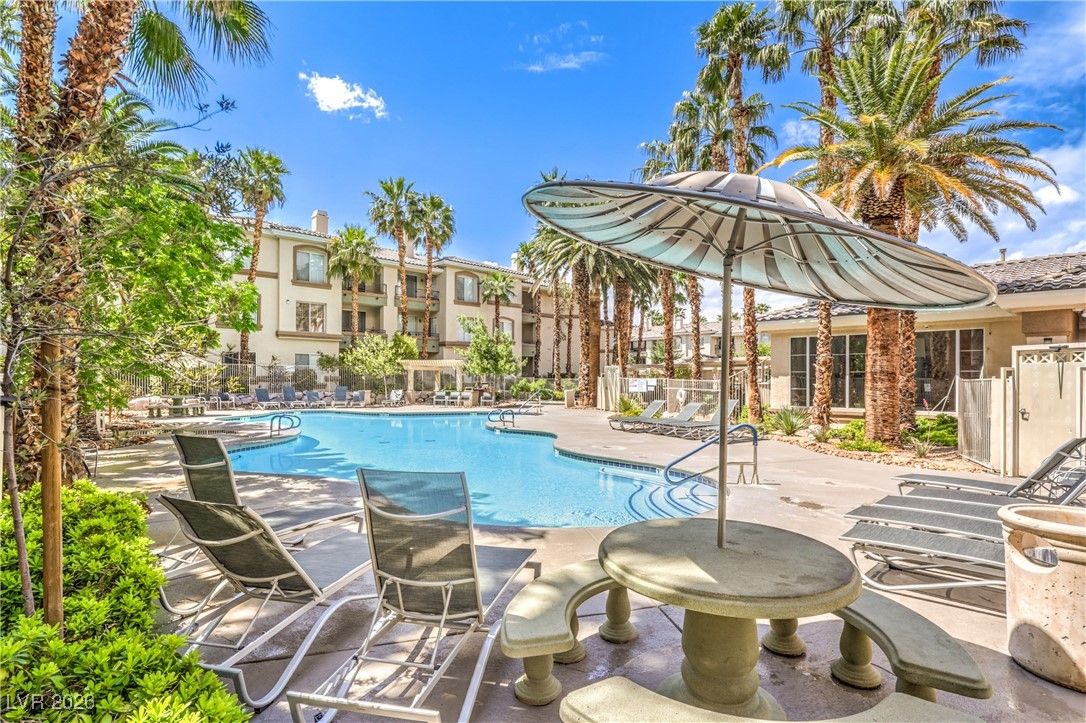
$234,0002 bd2 ba962 sqft$243/sqft0.03 mi179 daysSold 2026-07-28
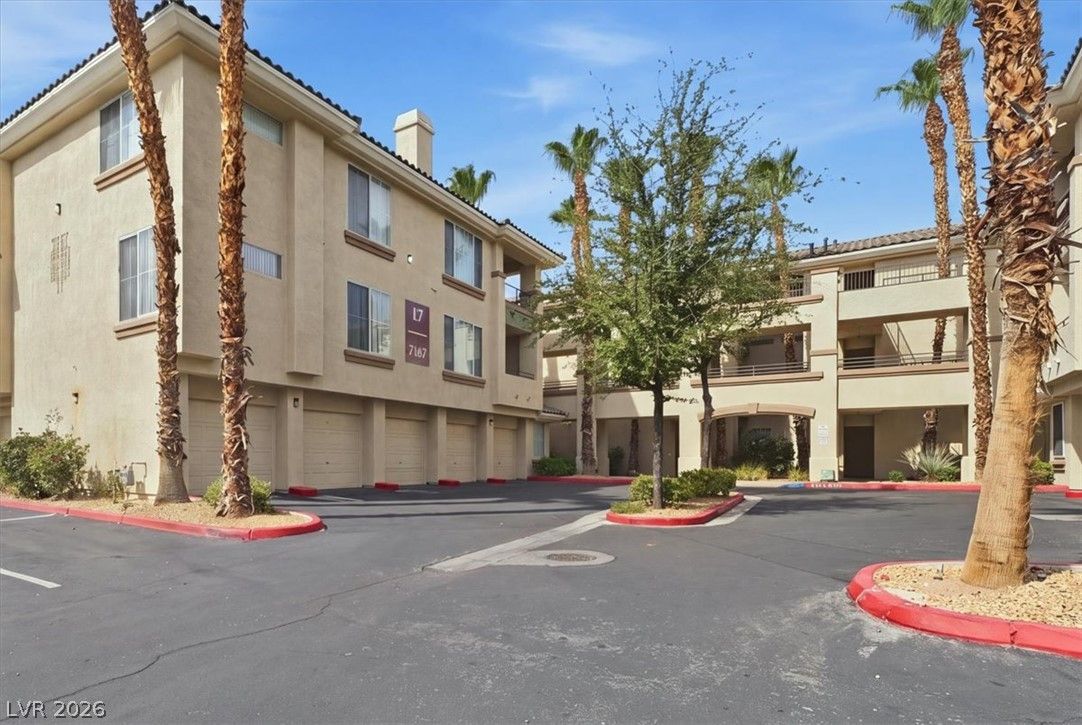
$225,0002 bd2 ba962 sqft$234/sqft0.06 mi32 days
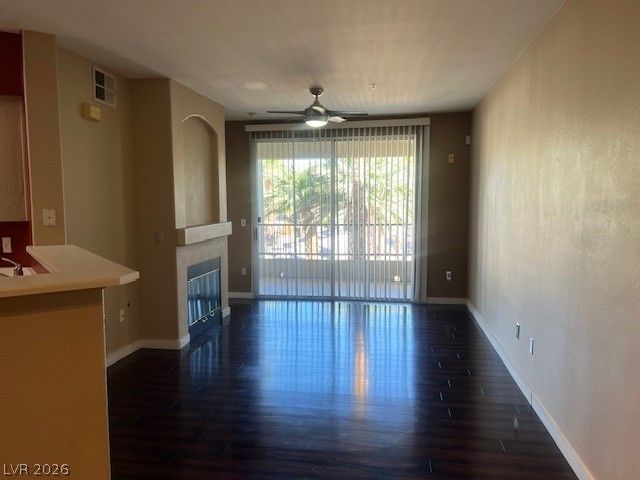
7173 Durango 308Sold
$205,0002 bd2 ba962 sqft$213/sqft0.07 mi13 daysSold 2026-08-14
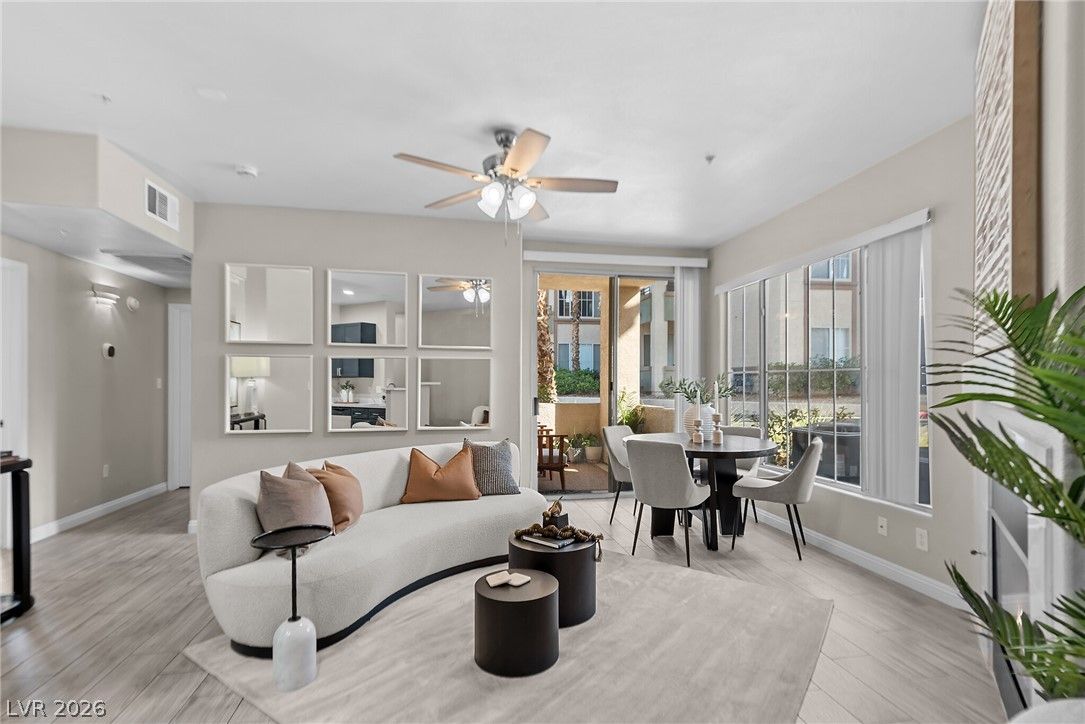
$239,0002 bd2 ba929 sqft$257/sqft0.08 mi43 days

7147 South Durango Drive 201Pending
$193,9991 bd1 ba816 sqft$238/sqft0.08 mi35 days
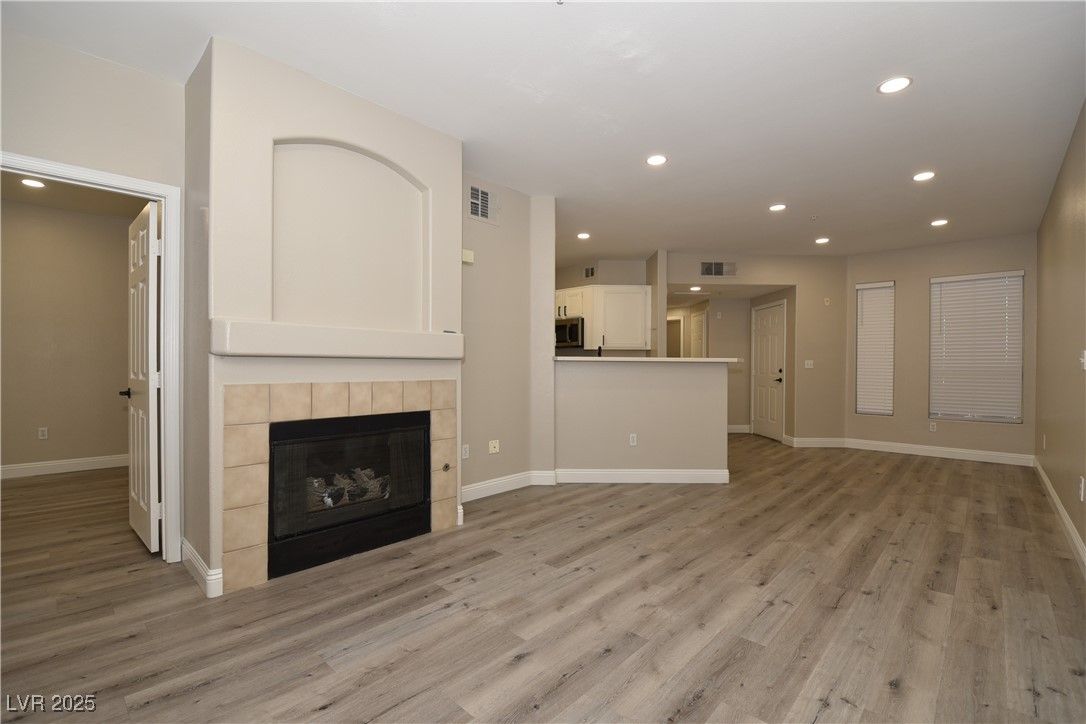
7155 South Durango Drive 207Pending
$219,5002 bd2 ba962 sqft$228/sqft0.08 mi357 days
Nearest comparable sales and listings
12 comparables · median price $220,250 · range $175,000 – $247,000 · median $/sq ft $240 · average $/sq ft $243
| Address | Status | Price | $/Sq Ft | Bd / Ba | Sq Ft | Sold / market time | Distance |
|---|---|---|---|---|---|---|---|
| 7139 South Durango Drive 106 | Active | $215,000 | $237 | 2 / 2 | 906 | 65 days on market | 0.00 mi |
| 7139 South Durango Drive 116 | Sold | $200,000 | $269 | 1 / 1 | 743 | Sold 2026-06-18 | 0.00 mi |
| 7119 South Durango Drive 105 | Pending | $230,000 | $248 | 2 / 2 | 929 | 69 days on market | 0.03 mi |
| 7119 South Durango Drive 202 | Sold | $175,000 | $236 | 1 / 1 | 743 | Sold 2026-06-08 | 0.03 mi |
| 7119 South Durango Drive 207 | Sold | $234,000 | $243 | 2 / 2 | 962 | Sold 2026-07-28 | 0.03 mi |
| 7167 South Durango Drive 307 | Active | $225,000 | $234 | 2 / 2 | 962 | 32 days on market | 0.06 mi |
| 7173 Durango 308 | Sold | $205,000 | $213 | 2 / 2 | 962 | Sold 2026-08-14 | 0.07 mi |
| 7147 South Durango Drive 105 | Active | $239,000 | $257 | 2 / 2 | 929 | 43 days on market | 0.08 mi |
| 7147 South Durango Drive 201 | Pending | $193,999 | $238 | 1 / 1 | 816 | 35 days on market | 0.08 mi |
| 7155 South Durango Drive 207 | Pending | $219,500 | $228 | 2 / 2 | 962 | 357 days on market | 0.08 mi |
| 7147 South Durango Drive 105 | Sold | $247,000 | $266 | 2 / 2 | 929 | Sold 2026-05-26 | 0.08 mi |
| 7155 South Durango Drive 104 | Sold | $221,000 | $244 | 2 / 2 | 906 | Sold 2026-07-08 | 0.08 mi |


