
Comparable Sales Near 9202 Branford Hills Street, Las Vegas, NV 89123
1st Realty · Comparable sales report · 1st.estate · October 20, 2026
Browse our Las Vegas area guides →
9202 Branford Hills Street, Las Vegas, NV 89123
Status: Sold
$551,000 Sold Price
$228
$ / Sq Ft
2,415
Living Area
6,534 sqft
Lot Size
3
Beds
3
Baths
2004
Year Built
Search Parameters
Property Type
Status
Radius
Sold Within
Beds
Baths
Living Area (Sq Ft)
Lot Size (Sq Ft)
This comp search reflects your current search parameters — adjust the filters above as needed for a more accurate estimate.
Estimated Value
—
Average $/Sqft
—
Check one or more comps below to calculate an estimate.
Nearest 10 of 42 comparable sales and listings within 1 mile of this home. Use the filters above and press Search to refine.
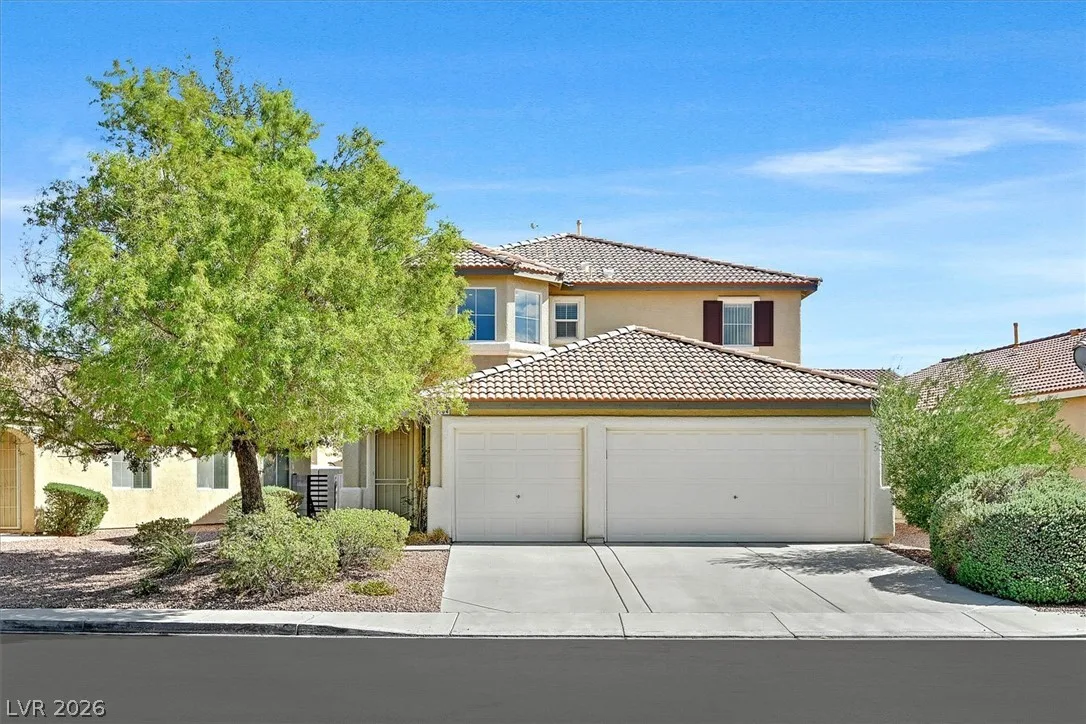
9164 Marlia StreetActive
$499,9993 bd3 ba2,436 sqft$205/sqft0.07 mi2 days
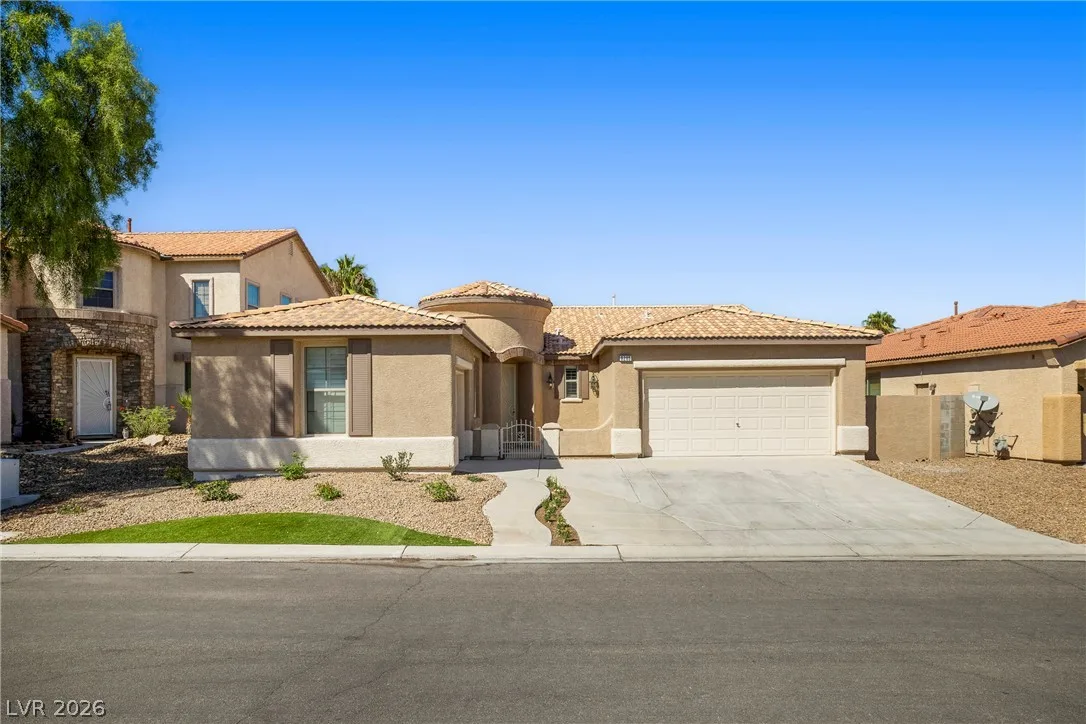
9205 Edgeworth PlaceActive
$565,0003 bd3 ba2,415 sqft$234/sqft0.15 mi3 days
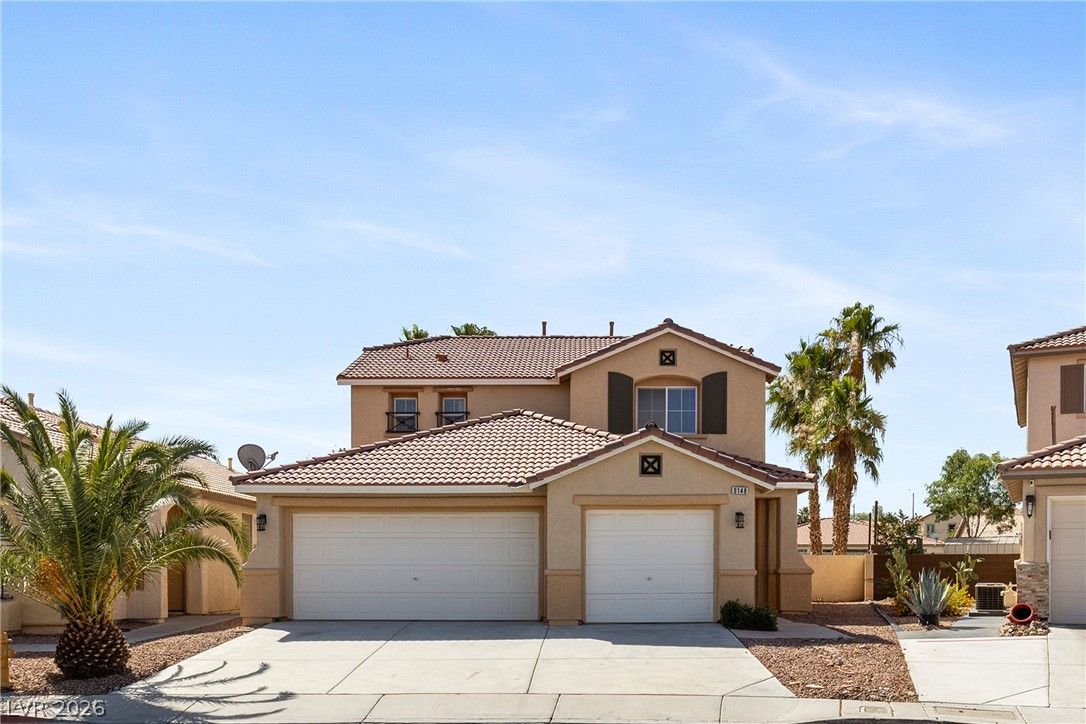
$510,0003 bd3 ba2,303 sqft$221/sqft0.16 mi12 daysSold 2026-07-24
$640,0004 bd3 ba2,303 sqft$278/sqft0.17 mi4 daysSold 2026-07-02
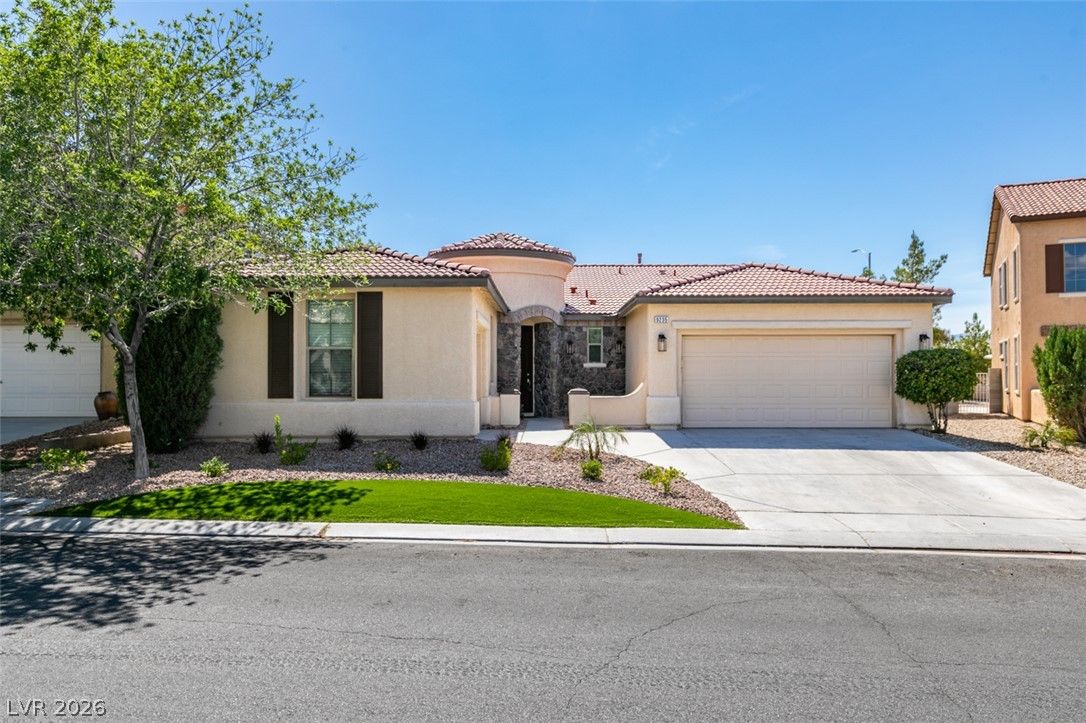
$575,0003 bd3 ba2,415 sqft$238/sqft0.18 mi29 daysSold 2026-08-07
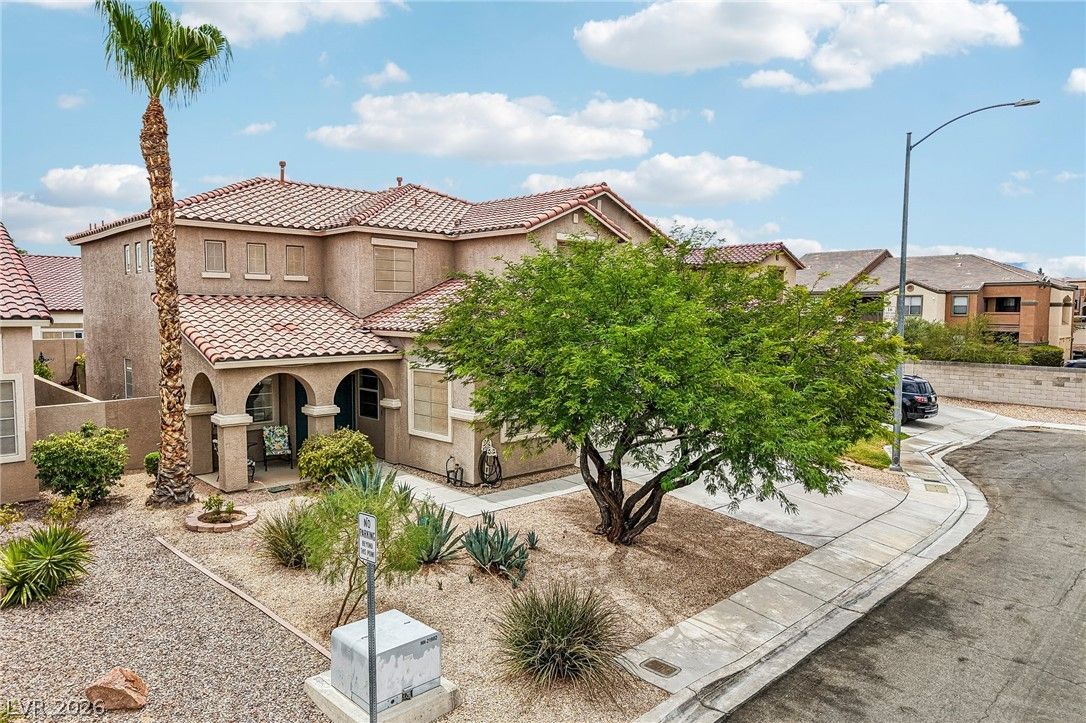
$589,0004 bd3 ba2,934 sqft$201/sqft0.27 mi23 daysSold 2026-09-22
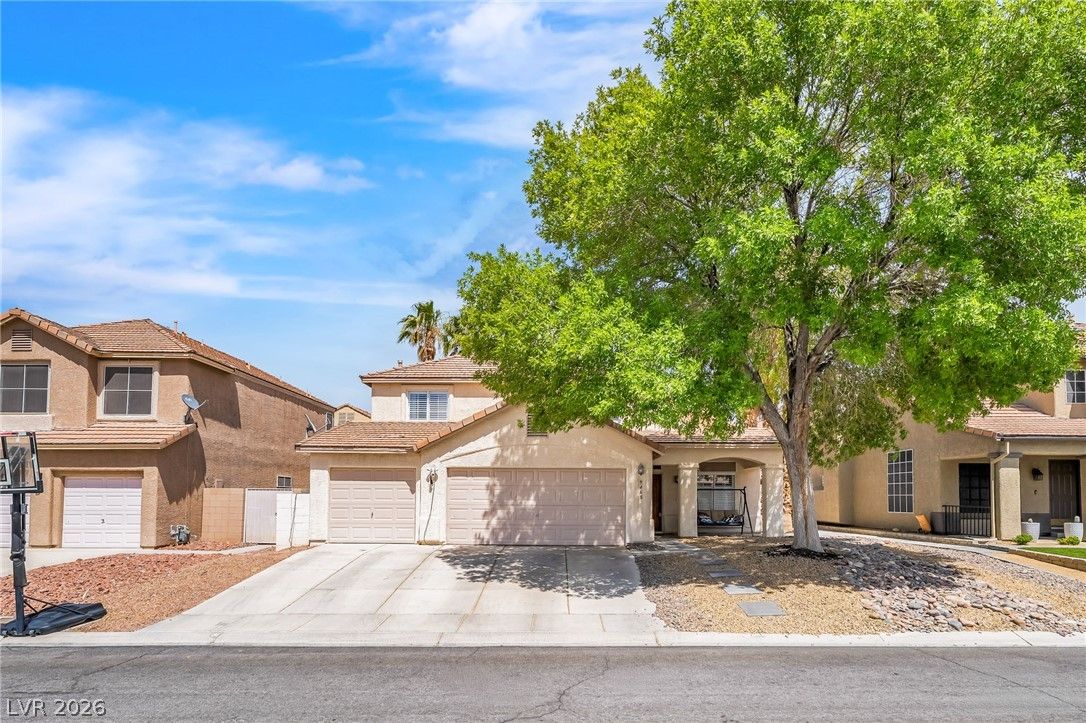
$480,0003 bd3 ba2,776 sqft$173/sqft0.34 mi2 daysSold 2026-09-17
$499,9994 bd3 ba2,523 sqft$198/sqft0.34 mi25 daysSold 2026-04-23
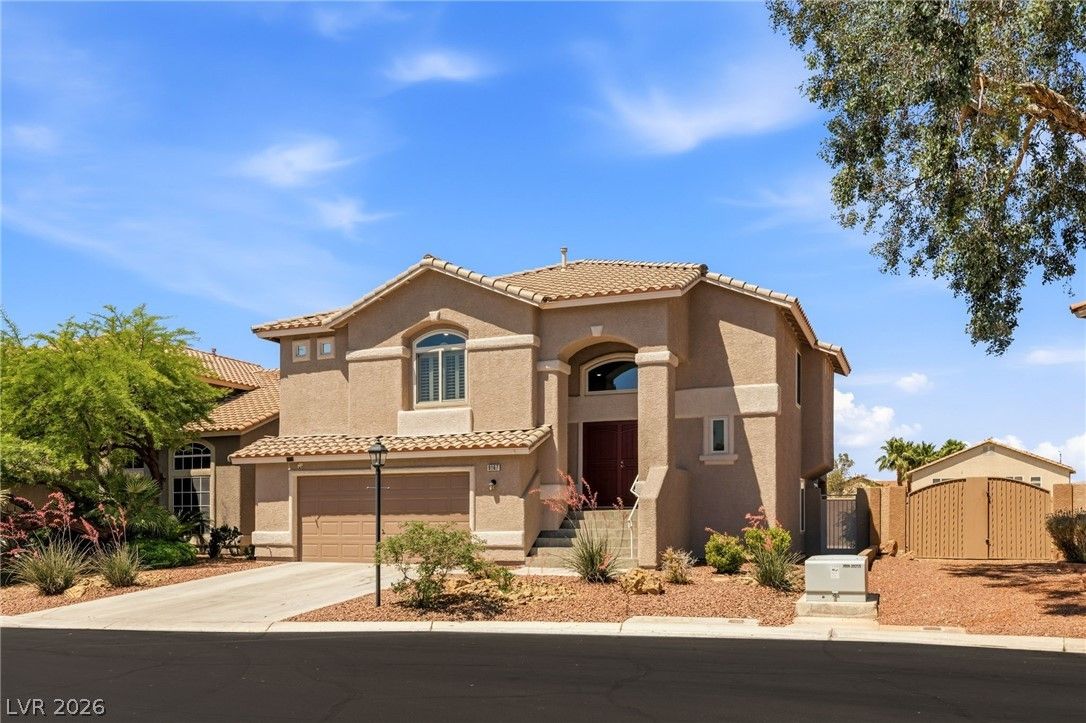
$490,0003 bd3 ba2,174 sqft$225/sqft0.34 mi16 daysSold 2026-08-14
$520,0003 bd3 ba1,931 sqft$269/sqft0.35 mi14 daysSold 2026-05-15
Nearest comparable sales and listings
12 comparables · median price $542,500 · range $480,000 – $640,000 · median $/sq ft $230 · average $/sq ft $228
| Address | Status | Price | $/Sq Ft | Bd / Ba | Sq Ft | Sold / market time | Distance |
|---|---|---|---|---|---|---|---|
| 9164 Marlia Street | Active | $499,999 | $205 | 3 / 3 | 2,436 | 2 days on market | 0.07 mi |
| 9205 Edgeworth Place | Active | $565,000 | $234 | 3 / 3 | 2,415 | 3 days on market | 0.15 mi |
| 9148 Manalang Road | Sold | $510,000 | $221 | 3 / 3 | 2,303 | Sold 2026-07-24 | 0.16 mi |
| 495 Manderley Court | Sold | $640,000 | $278 | 4 / 3 | 2,303 | Sold 2026-07-02 | 0.17 mi |
| 9235 Edgeworth Place | Sold | $575,000 | $238 | 3 / 3 | 2,415 | Sold 2026-08-07 | 0.18 mi |
| 529 Clement Court | Sold | $589,000 | $201 | 4 / 3 | 2,934 | Sold 2026-09-22 | 0.27 mi |
| 9468 Coral Shine Court | Sold | $480,000 | $173 | 3 / 3 | 2,776 | Sold 2026-09-17 | 0.34 mi |
| 9239 Sleeping Tree Street | Sold | $499,999 | $198 | 4 / 3 | 2,523 | Sold 2026-04-23 | 0.34 mi |
| 9167 Sleeping Tree Street | Sold | $490,000 | $225 | 3 / 3 | 2,174 | Sold 2026-08-14 | 0.34 mi |
| 9476 Coral Shine Court | Sold | $520,000 | $269 | 3 / 3 | 1,931 | Sold 2026-05-15 | 0.35 mi |
| 823 Rusty Branch Avenue | Sold | $595,000 | $236 | 4 / 3 | 2,523 | Sold 2026-06-26 | 0.36 mi |
| 9039 Danesbury Court | Sold | $600,000 | $259 | 4 / 3 | 2,321 | Sold 2026-06-24 | 0.37 mi |


