
Comparable Sales Near 5730 Sky Pointe Drive 171, Las Vegas, NV 89130
1st Realty · Comparable sales report · 1st.estate · October 20, 2026
Browse our Las Vegas area guides →
5730 Sky Pointe Drive 171, Las Vegas, NV 89130
Status: Sold
$1,800 Sold Price
$1
$ / Sq Ft
1,549
Living Area
6,534 sqft
Lot Size
3
Beds
3
Baths
2022
Year Built
Search Parameters
Property Type
Status
Radius
Sold Within
Beds
Baths
Living Area (Sq Ft)
Lot Size (Sq Ft)
This comp search reflects your current search parameters — adjust the filters above as needed for a more accurate estimate.
Estimated Value
—
Average $/Sqft
—
Check one or more comps below to calculate an estimate.
Nearest 10 of 38 comparable sales and listings within 1 mile of this home. Use the filters above and press Search to refine.
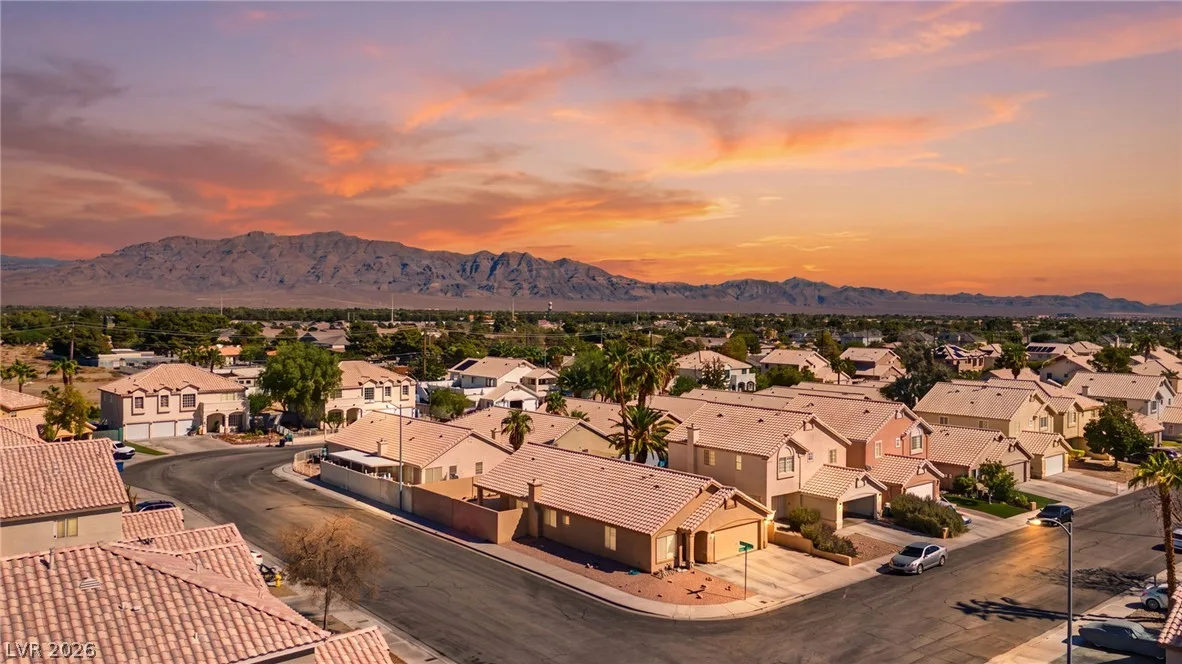
$429,9903 bd3 ba1,865 sqft$231/sqft0.22 mi4 days
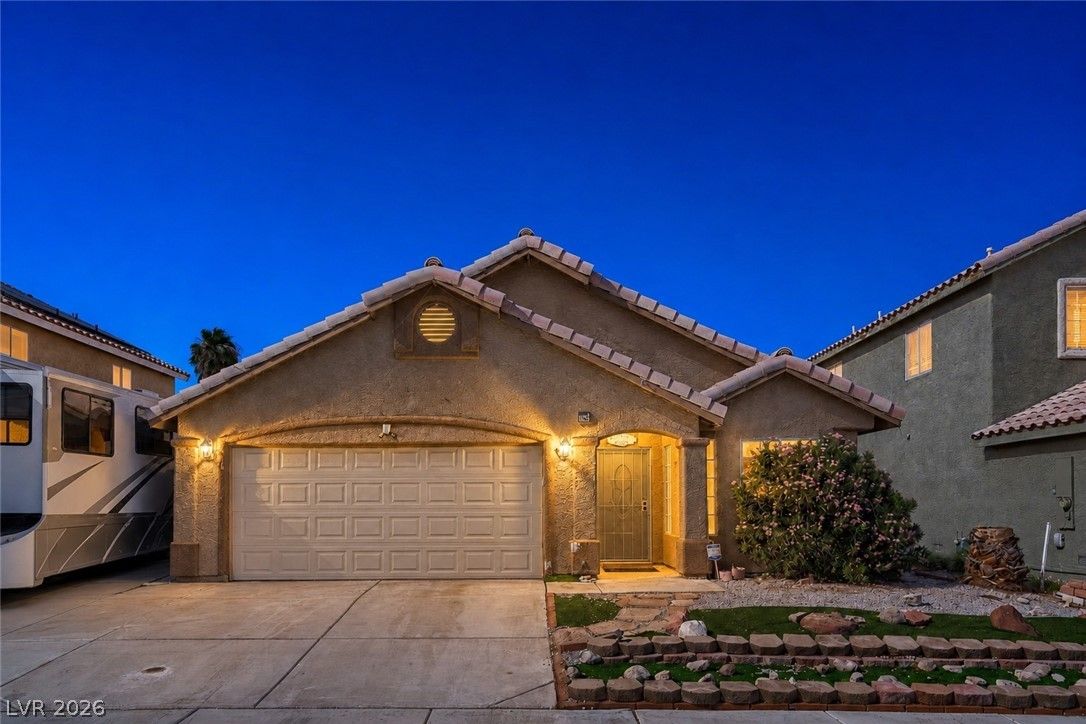
7004 Magic Window AvenueActive
$500,0003 bd2 ba1,459 sqft$343/sqft0.27 mi25 days
$450,0003 bd2 ba1,634 sqft$275/sqft0.32 mi0 daysSold 2026-07-14
$435,0003 bd2 ba1,687 sqft$258/sqft0.48 mi32 daysSold 2026-04-29
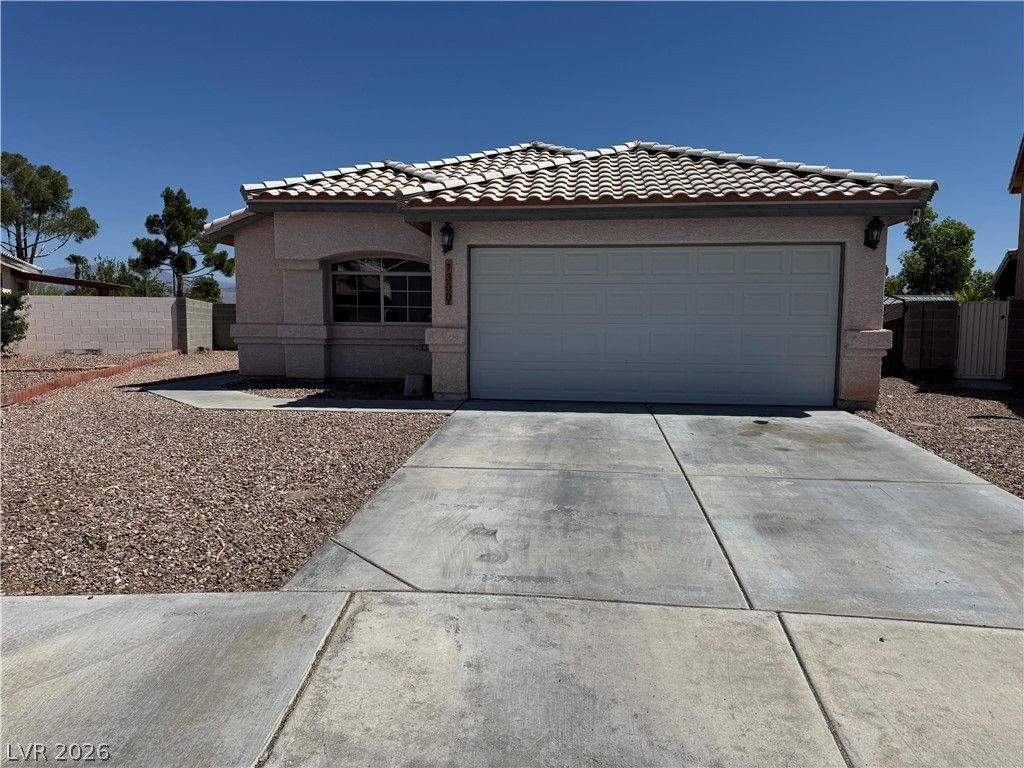
$380,0003 bd2 ba1,307 sqft$291/sqft0.48 mi29 daysSold 2026-09-14
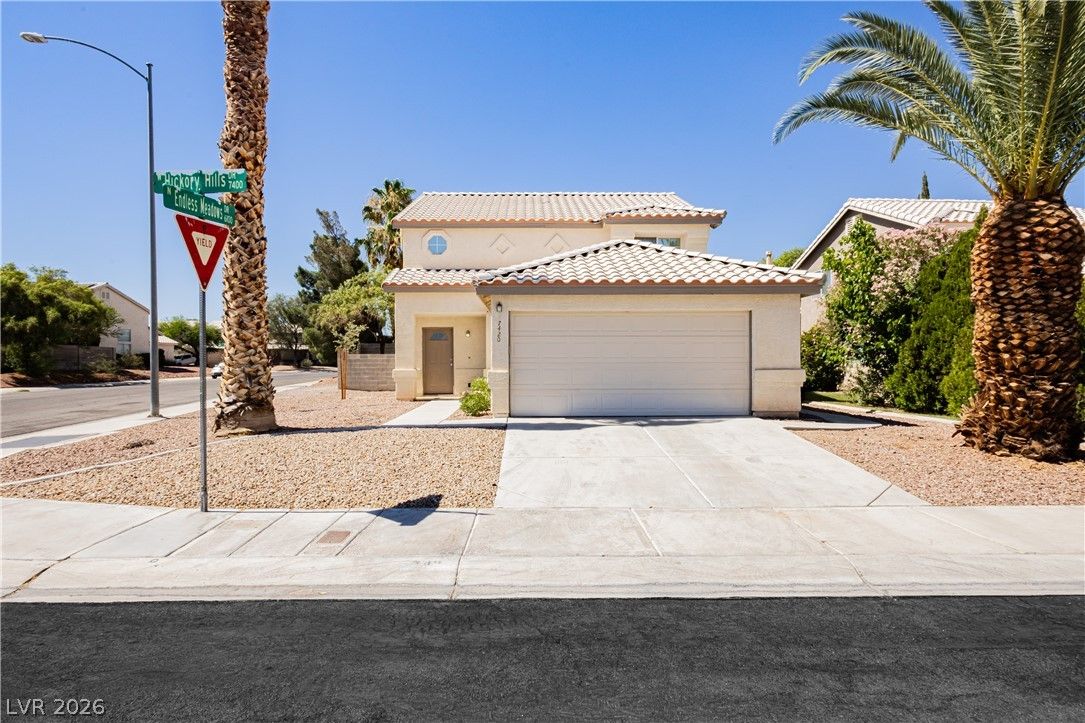
$400,0003 bd3 ba1,570 sqft$255/sqft0.50 mi40 daysSold 2026-09-02
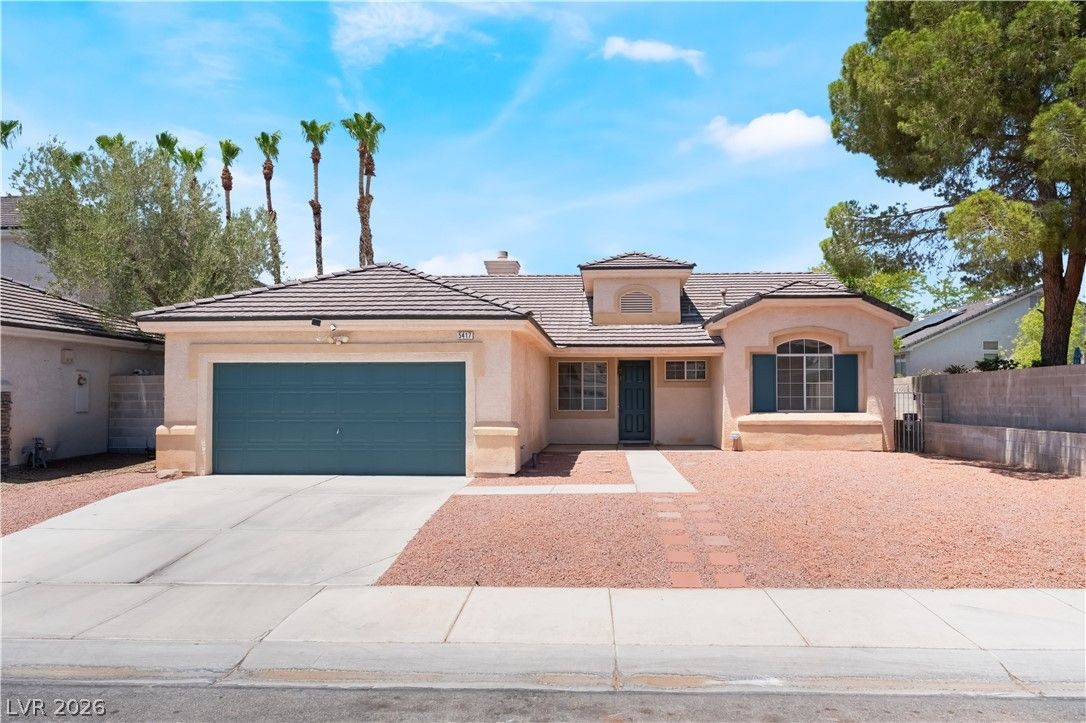
$425,9903 bd2 ba1,773 sqft$240/sqft0.52 mi8 daysSold 2026-09-08
$400,0003 bd2 ba1,352 sqft$296/sqft0.53 mi8 daysSold 2026-08-07
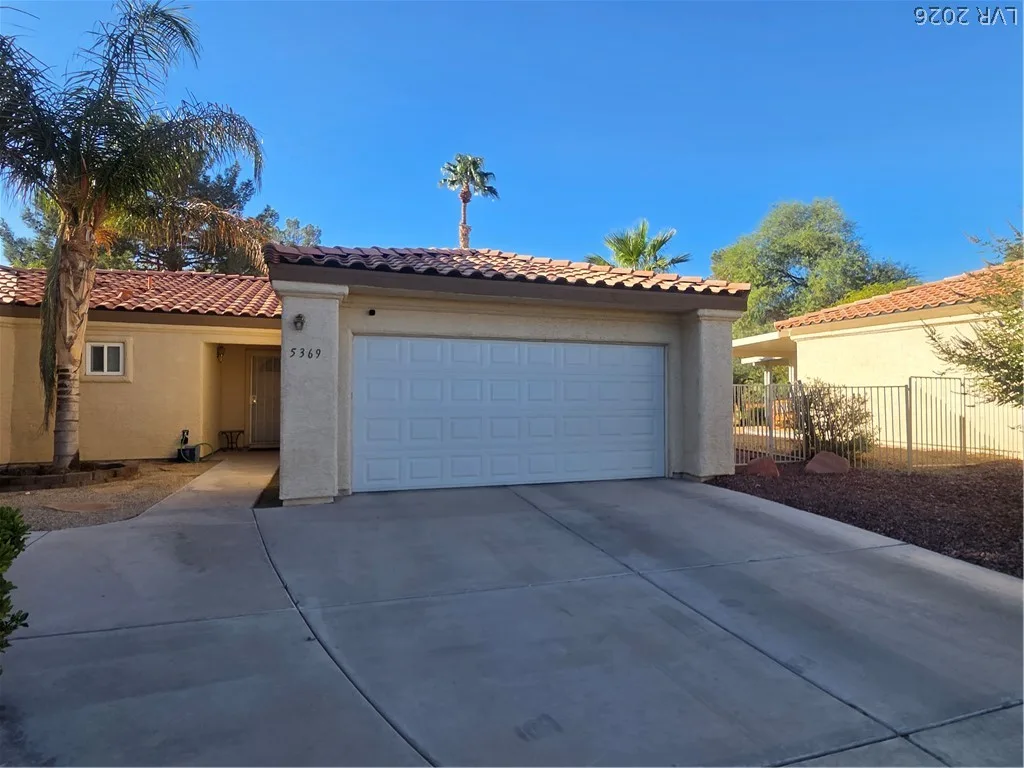
$347,9992 bd2 ba1,431 sqft$243/sqft0.54 mi0 days
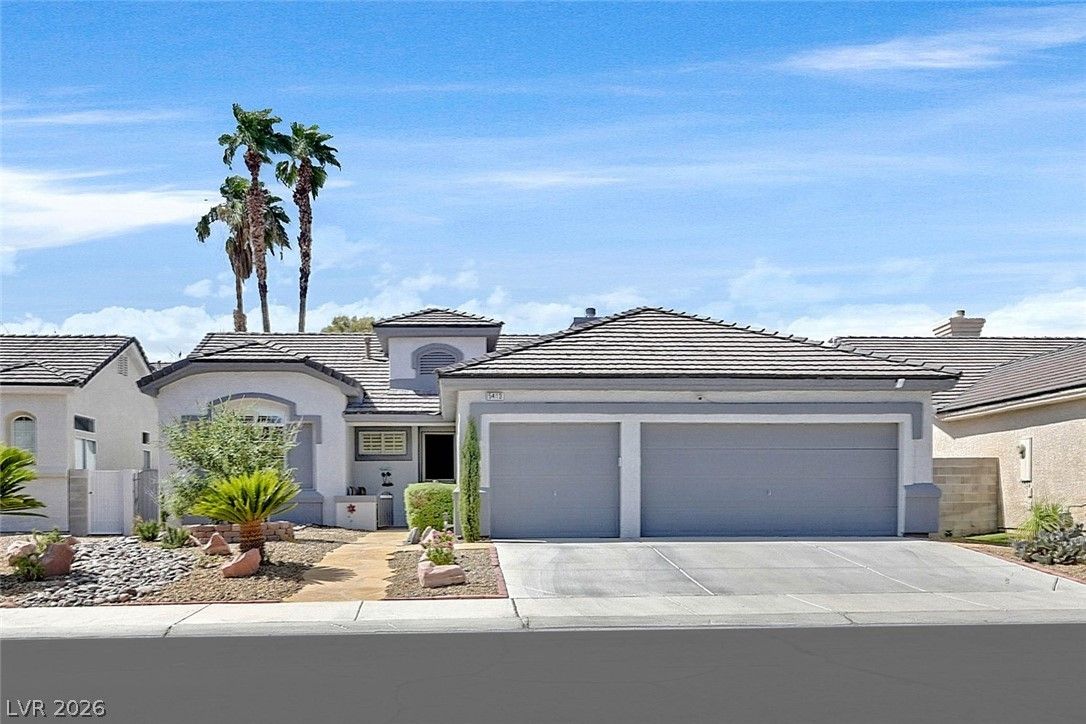
5413 Goldbrush StreetActive
$524,9003 bd2 ba1,774 sqft$296/sqft0.56 mi22 days
Nearest comparable sales and listings
12 comparables · median price $427,990 · range $295,000 – $524,900 · median $/sq ft $256 · average $/sq ft $264
| Address | Status | Price | $/Sq Ft | Bd / Ba | Sq Ft | Sold / market time | Distance |
|---|---|---|---|---|---|---|---|
| 7232 London Bridge Avenue | Active | $429,990 | $231 | 3 / 3 | 1,865 | 4 days on market | 0.22 mi |
| 7004 Magic Window Avenue | Active | $500,000 | $343 | 3 / 2 | 1,459 | 25 days on market | 0.27 mi |
| 5709 Wandering Ivy Street | Sold | $450,000 | $275 | 3 / 2 | 1,634 | Sold 2026-07-14 | 0.32 mi |
| 6794 Weeping Fig Court | Sold | $435,000 | $258 | 3 / 2 | 1,687 | Sold 2026-04-29 | 0.48 mi |
| 7300 Young Doe Avenue | Sold | $380,000 | $291 | 3 / 2 | 1,307 | Sold 2026-09-14 | 0.48 mi |
| 7420 Hickory Hills Drive | Sold | $400,000 | $255 | 3 / 3 | 1,570 | Sold 2026-09-02 | 0.50 mi |
| 5417 Rose Thicket Street | Sold | $425,990 | $240 | 3 / 2 | 1,773 | Sold 2026-09-08 | 0.52 mi |
| 7628 Desert Cactus Circle | Sold | $400,000 | $296 | 3 / 2 | 1,352 | Sold 2026-08-07 | 0.53 mi |
| 5369 Painted Mirage Road na | Active | $347,999 | $243 | 2 / 2 | 1,431 | 0 days on market | 0.54 mi |
| 5413 Goldbrush Street | Active | $524,900 | $296 | 3 / 2 | 1,774 | 22 days on market | 0.56 mi |
| 7625 Rolling View Drive 202 | Active | $439,950 | $247 | 2 / 2 | 1,781 | 6 days on market | 0.57 mi |
| 7625 Valley Green Drive 201 | Active | $295,000 | $198 | 2 / 2 | 1,488 | 0 days on market | 0.57 mi |


