
Comparable Sales Near 9053 Herring Cove Avenue, Las Vegas, NV 89178
1st Realty · Comparable sales report · 1st.estate · October 21, 2026
Read the Enterprise neighborhood guide →
9053 Herring Cove Avenue, Las Vegas, NV 89178
Status: Sold
$1,895 Sold Price
$1
$ / Sq Ft
2,252
Living Area
4,356 sqft
Lot Size
3
Beds
3
Baths
2006
Year Built
Search Parameters
Property Type
Status
Radius
Sold Within
Beds
Baths
Living Area (Sq Ft)
Lot Size (Sq Ft)
This comp search reflects your current search parameters — adjust the filters above as needed for a more accurate estimate.
Estimated Value
—
Average $/Sqft
—
Check one or more comps below to calculate an estimate.
Nearest 10 of 126 comparable sales and listings within 1 mile of this home. Use the filters above and press Search to refine.
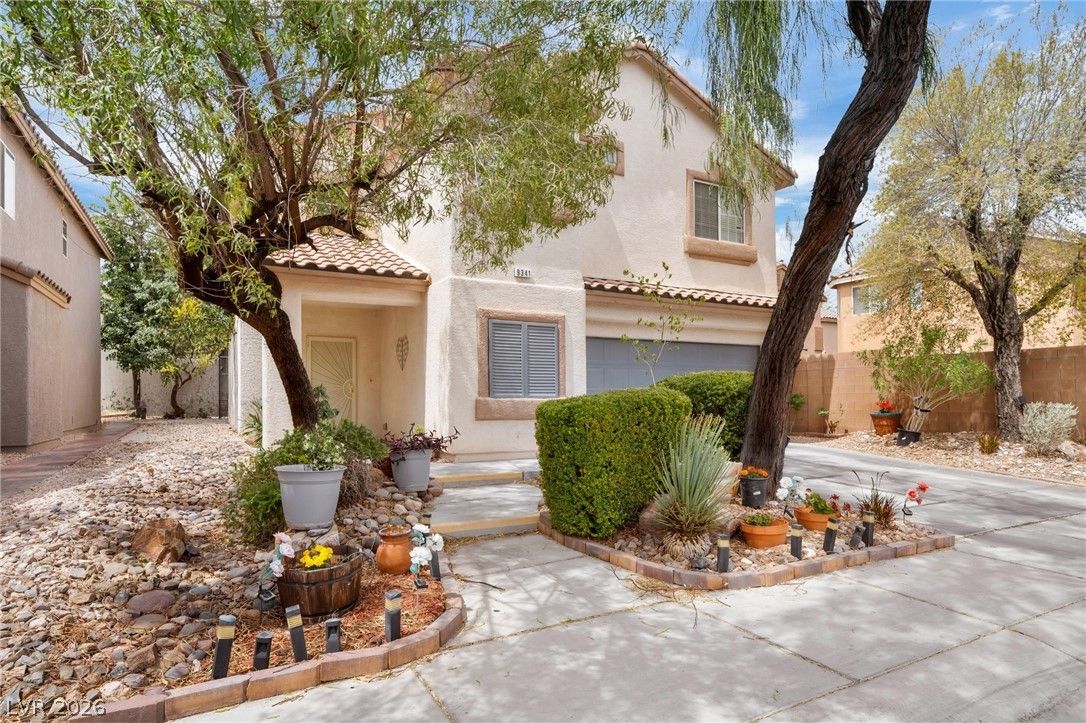
$415,0003 bd3 ba1,793 sqft$231/sqft0.02 mi82 daysSold 2026-08-05
$430,0003 bd3 ba1,793 sqft$240/sqft0.07 mi41 daysSold 2026-05-18
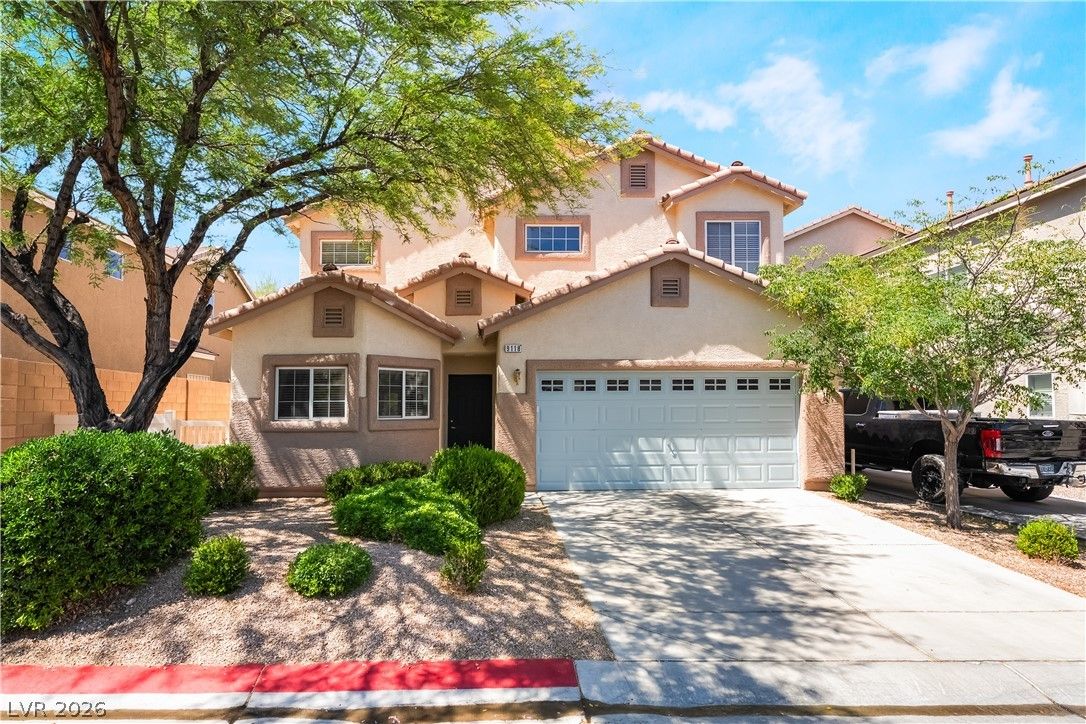
$394,6803 bd3 ba2,012 sqft$196/sqft0.08 mi71 daysSold 2026-09-01
$480,0004 bd3 ba2,404 sqft$200/sqft0.16 mi9 daysSold 2026-07-17
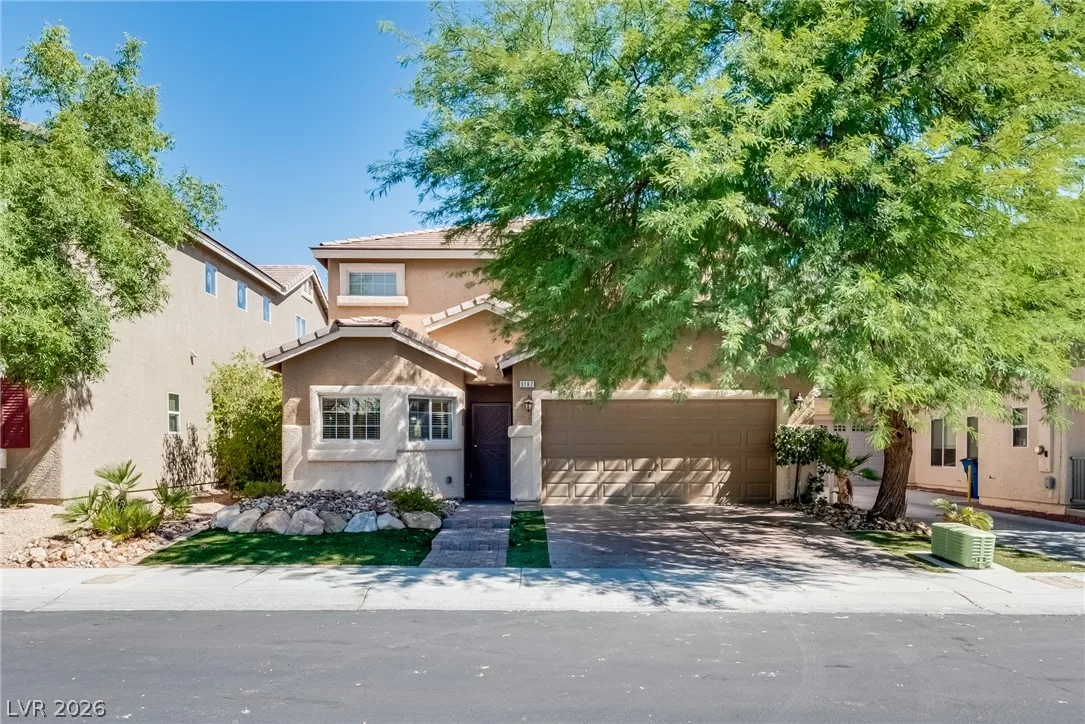
$450,0003 bd3 ba2,012 sqft$224/sqft0.17 mi14 days
$430,0003 bd3 ba2,196 sqft$196/sqft0.17 mi43 daysSold 2026-06-11
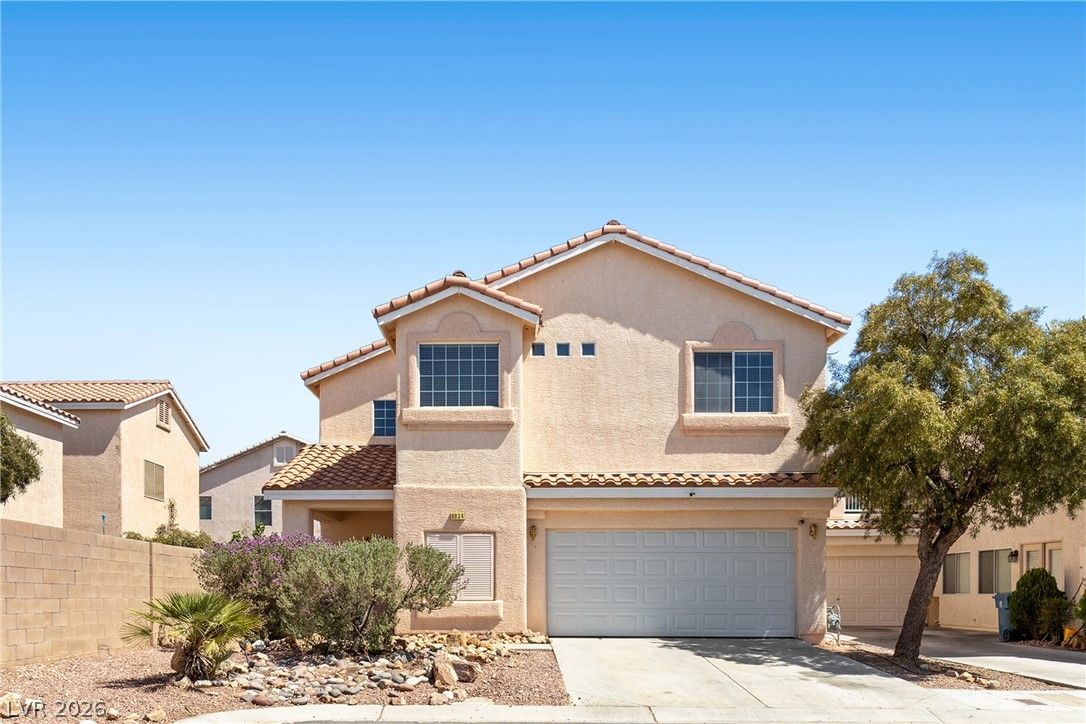
8934 Deep Ridge CourtActive
$405,0003 bd3 ba1,796 sqft$226/sqft0.18 mi116 days
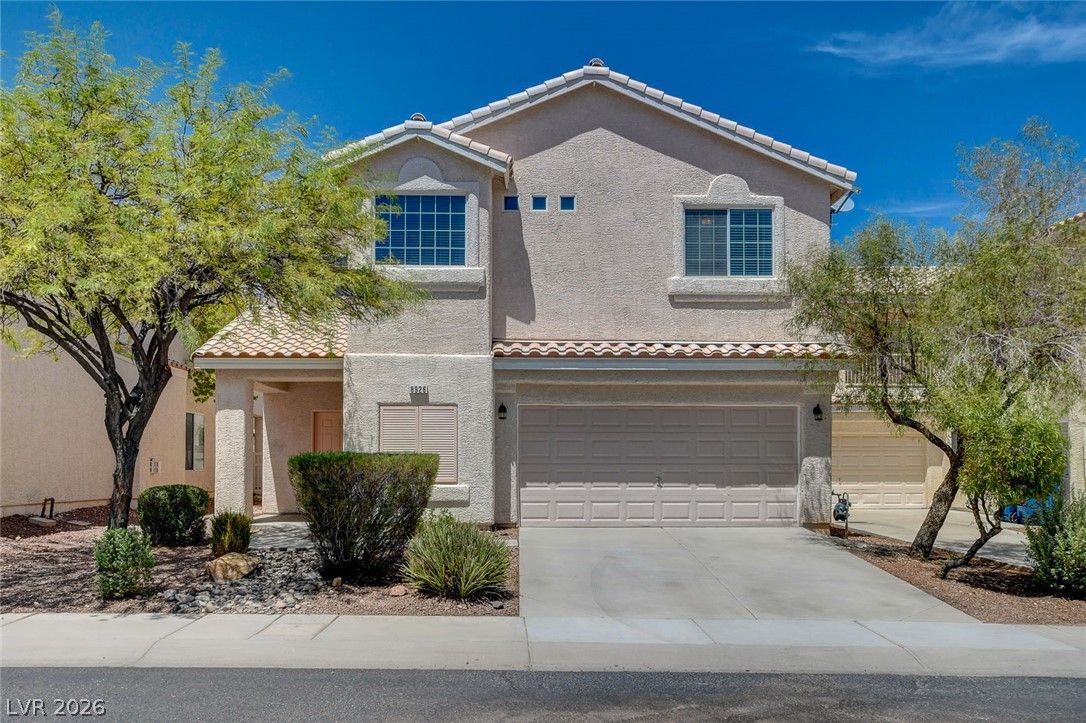
8926 Tomnitz AvenueActive
$399,9003 bd3 ba1,796 sqft$223/sqft0.19 mi54 days
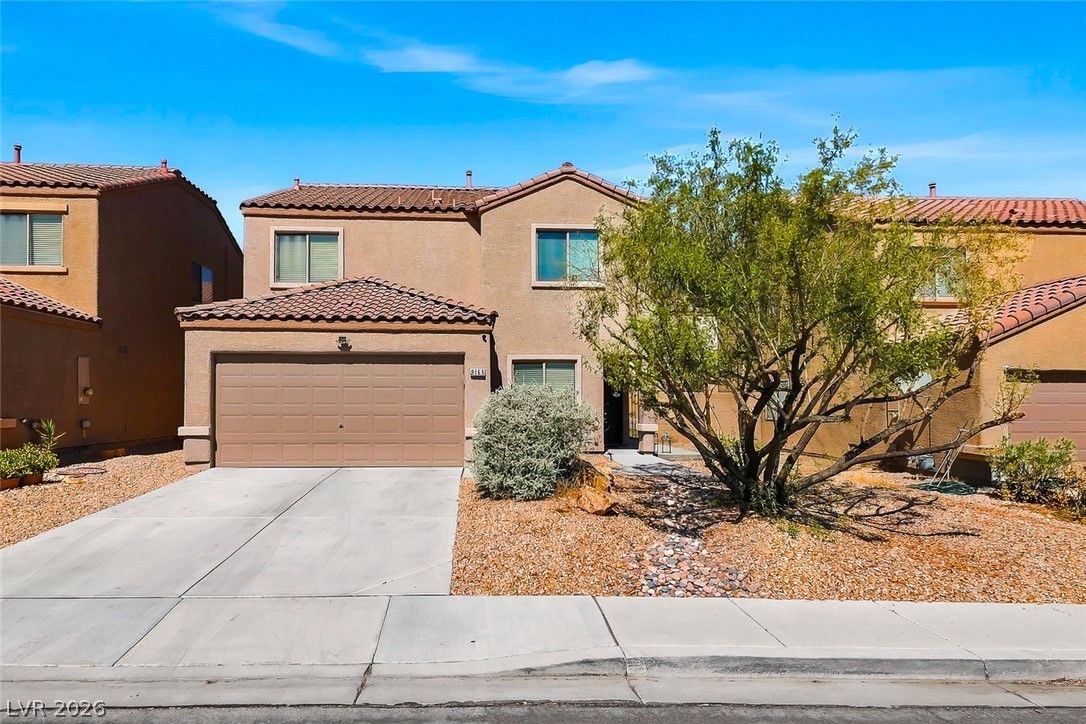
$410,0004 bd3 ba1,845 sqft$222/sqft0.19 mi25 daysSold 2026-10-02
$439,0003 bd2 ba1,762 sqft$249/sqft0.20 mi2 daysSold 2026-05-18
Nearest comparable sales and listings
12 comparables · median price $421,500 · range $394,680 – $480,000 · median $/sq ft $222 · average $/sq ft $217
| Address | Status | Price | $/Sq Ft | Bd / Ba | Sq Ft | Sold / market time | Distance |
|---|---|---|---|---|---|---|---|
| 9341 Sea Captain Street | Sold | $415,000 | $231 | 3 / 3 | 1,793 | Sold 2026-08-05 | 0.02 mi |
| 9004 Harbor Wind Avenue | Sold | $430,000 | $240 | 3 / 3 | 1,793 | Sold 2026-05-18 | 0.07 mi |
| 9118 Barnacle Bay Avenue | Sold | $394,680 | $196 | 3 / 3 | 2,012 | Sold 2026-09-01 | 0.08 mi |
| 8945 Houston Ridge Avenue | Sold | $480,000 | $200 | 4 / 3 | 2,404 | Sold 2026-07-17 | 0.16 mi |
| 9182 Sunken Meadow Avenue | Active | $450,000 | $224 | 3 / 3 | 2,012 | 14 days on market | 0.17 mi |
| 8964 Tom Noon Avenue | Sold | $430,000 | $196 | 3 / 3 | 2,196 | Sold 2026-06-11 | 0.17 mi |
| 8934 Deep Ridge Court | Active | $405,000 | $226 | 3 / 3 | 1,796 | 116 days on market | 0.18 mi |
| 8926 Tomnitz Avenue | Active | $399,900 | $223 | 3 / 3 | 1,796 | 54 days on market | 0.19 mi |
| 9165 Tramore Street | Sold | $410,000 | $222 | 4 / 3 | 1,845 | Sold 2026-10-02 | 0.19 mi |
| 9171 Placer Bullion Avenue | Sold | $439,000 | $249 | 3 / 2 | 1,762 | Sold 2026-05-18 | 0.20 mi |
| 8960 Catfish Stream Avenue | Under Contract | $399,000 | $200 | 3 / 3 | 1,992 | 70 days on market | 0.21 mi |
| 8930 Catfish Stream Avenue | Active | $428,000 | $195 | 3 / 3 | 2,196 | 172 days on market | 0.24 mi |


