
Comparable Sales Near 1100 Tam O Shanter, Las Vegas, NV 89109
1st Realty · Comparable sales report · 1st.estate · October 21, 2026
Browse our Las Vegas area guides →
1100 Tam O Shanter, Las Vegas, NV 89109
Status: Sold
$1,850 Sold Price
$1
$ / Sq Ft
1,400
Living Area
5,257 sqft
Lot Size
2
Beds
2
Baths
1968
Year Built
Search Parameters
Property Type
Status
Radius
Sold Within
Beds
Baths
Living Area (Sq Ft)
Lot Size (Sq Ft)
This comp search reflects your current search parameters — adjust the filters above as needed for a more accurate estimate.
Estimated Value
—
Average $/Sqft
—
Check one or more comps below to calculate an estimate.
Nearest 10 of 18 comparable sales and listings within 1 mile of this home. Use the filters above and press Search to refine.
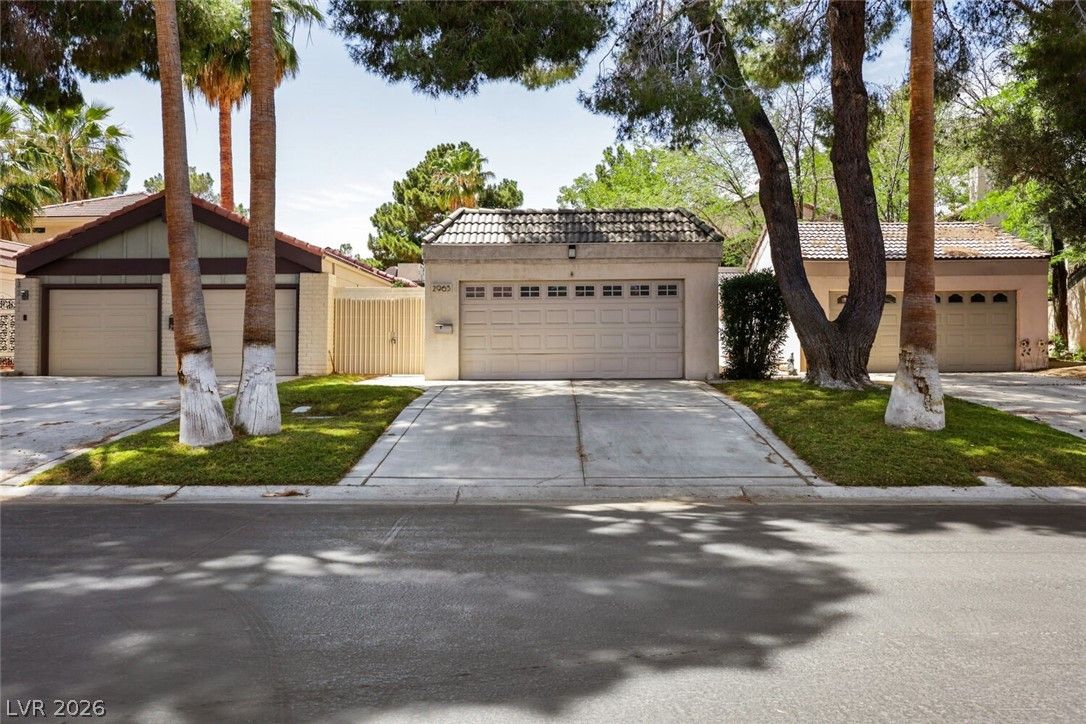
$460,0002 bd2 ba1,305 sqft$352/sqft0.30 mi93 daysSold 2026-07-31
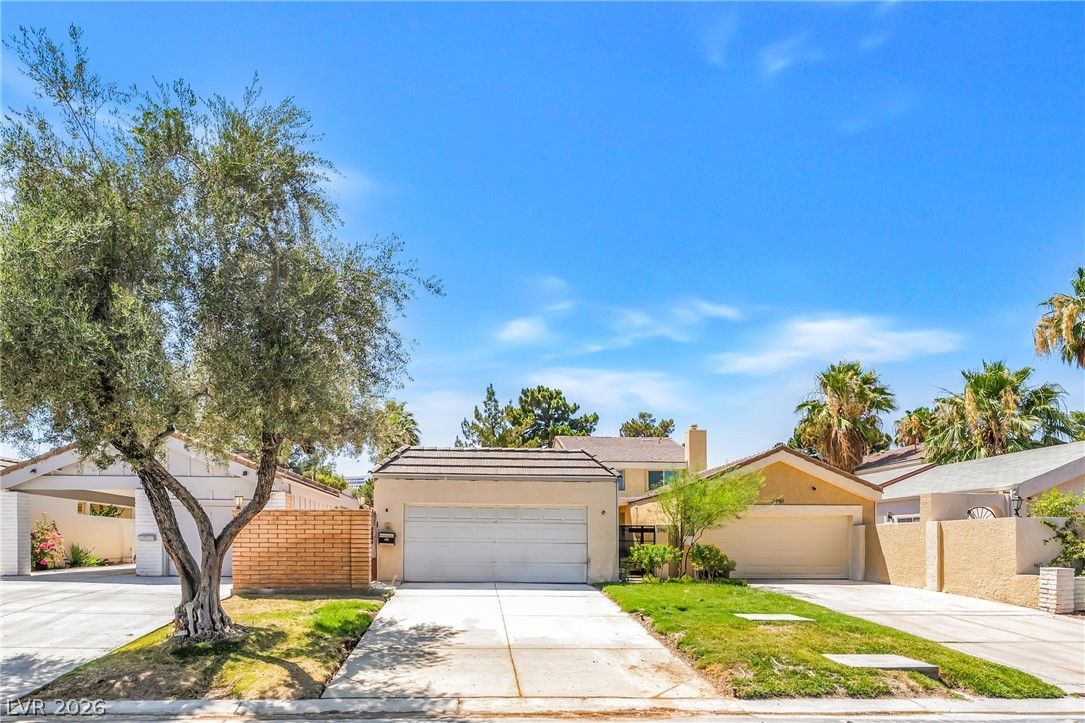
2985 Bel Air DriveActive
$455,0003 bd2 ba1,215 sqft$374/sqft0.32 mi91 days
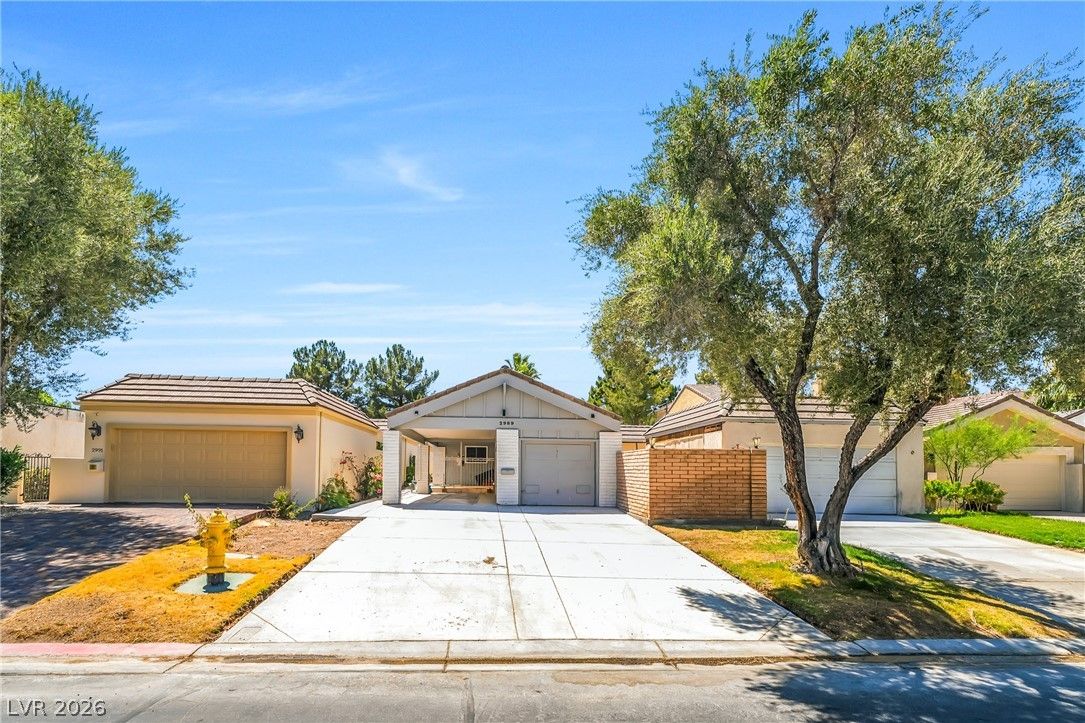
2989 Bel Air DriveActive
$585,0002 bd3 ba1,305 sqft$448/sqft0.33 mi101 days
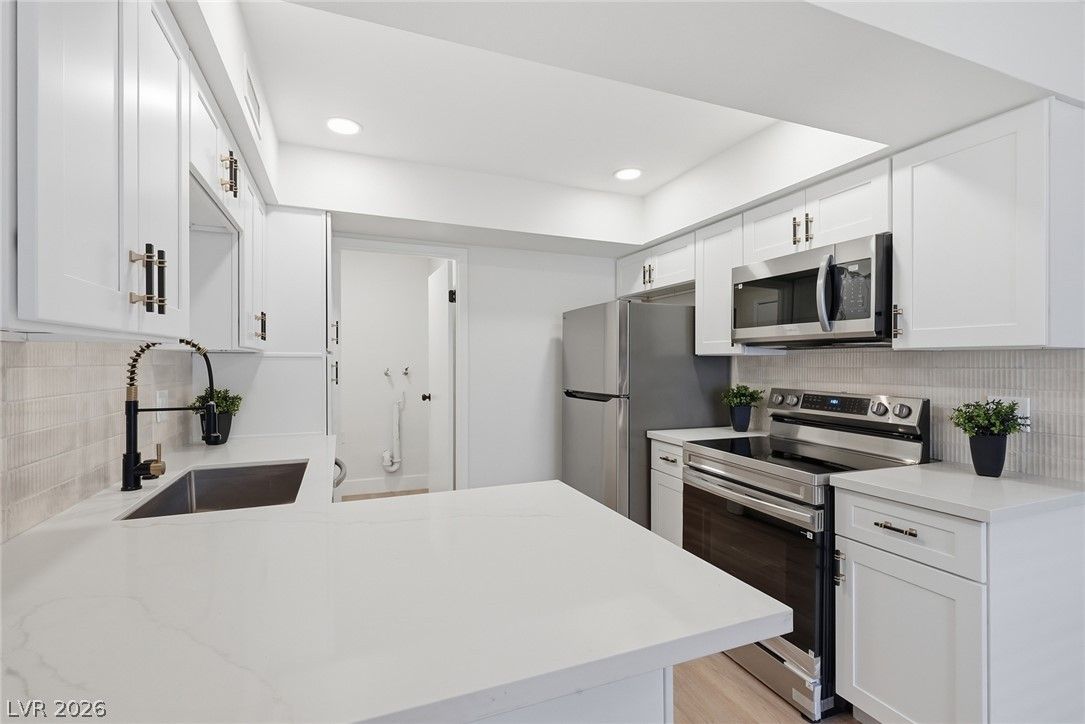
3045 Pinehurst Drive BActive
$299,0002 bd2 ba1,200 sqft$249/sqft0.39 mi61 days

3031 East Bel Air DriveActive
$539,9003 bd3 ba1,672 sqft$323/sqft0.39 mi41 days
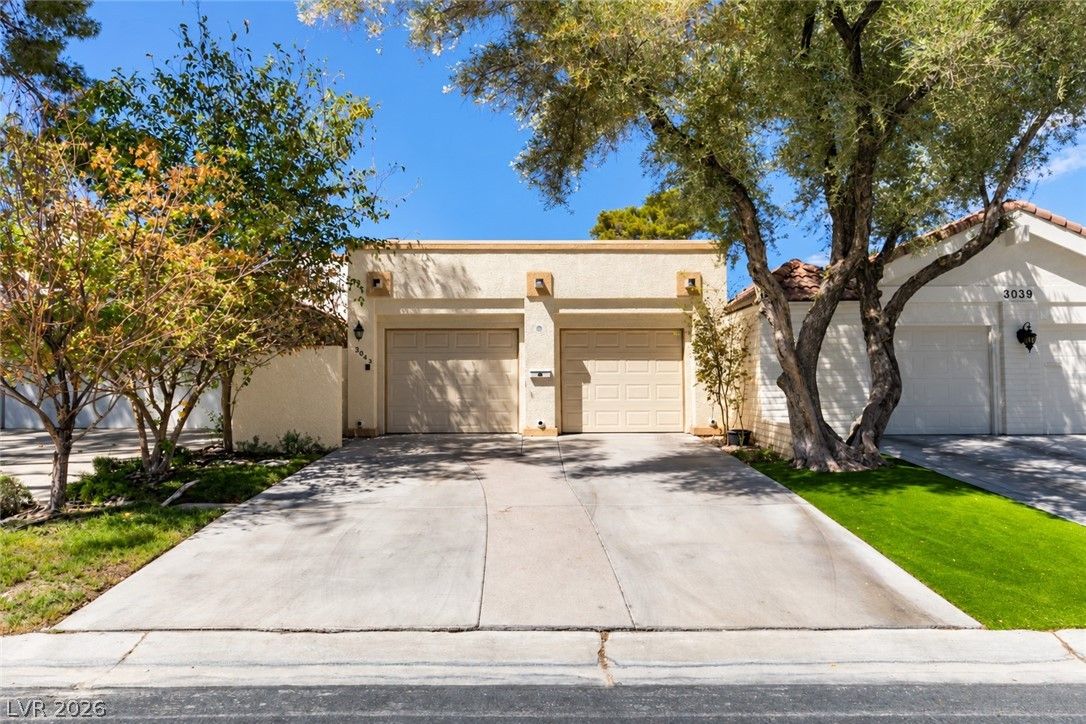
3043 Bel Air DriveActive
$489,9002 bd2 ba1,678 sqft$292/sqft0.41 mi25 days
$225,0002 bd1 ba1,099 sqft$205/sqft0.45 mi13 daysSold 2026-06-18
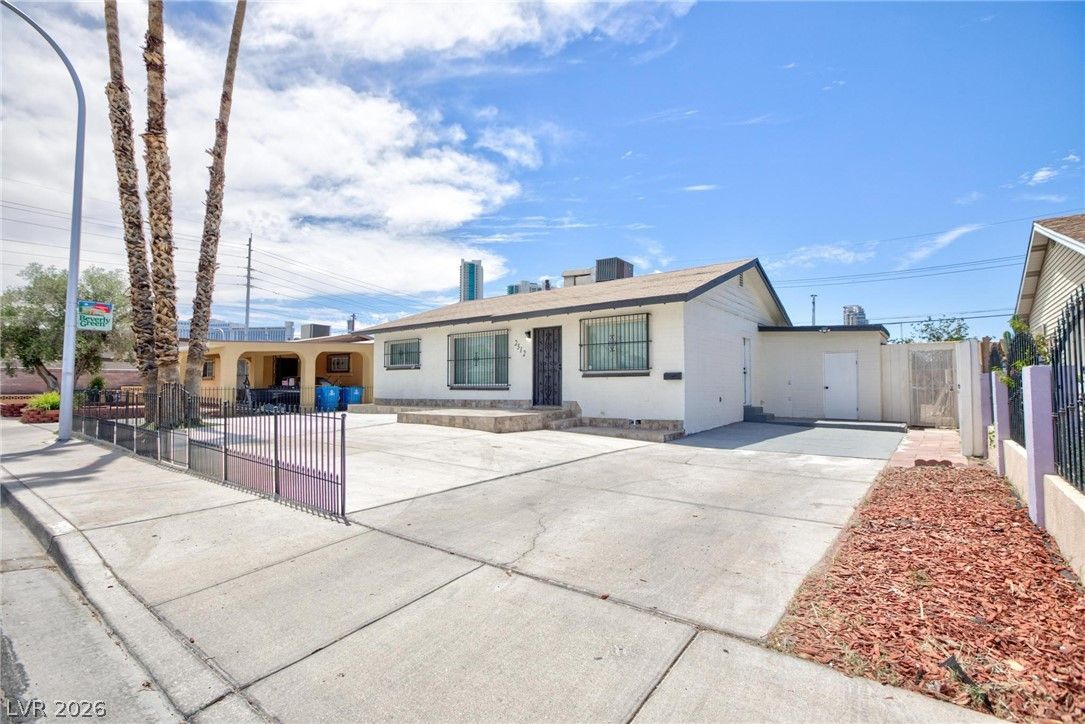
2312 Beverly WaySold
$345,0003 bd2 ba1,240 sqft$278/sqft0.56 mi9 daysSold 2026-07-31
$745,0003 bd3 ba1,672 sqft$446/sqft0.57 mi21 daysSold 2026-06-25
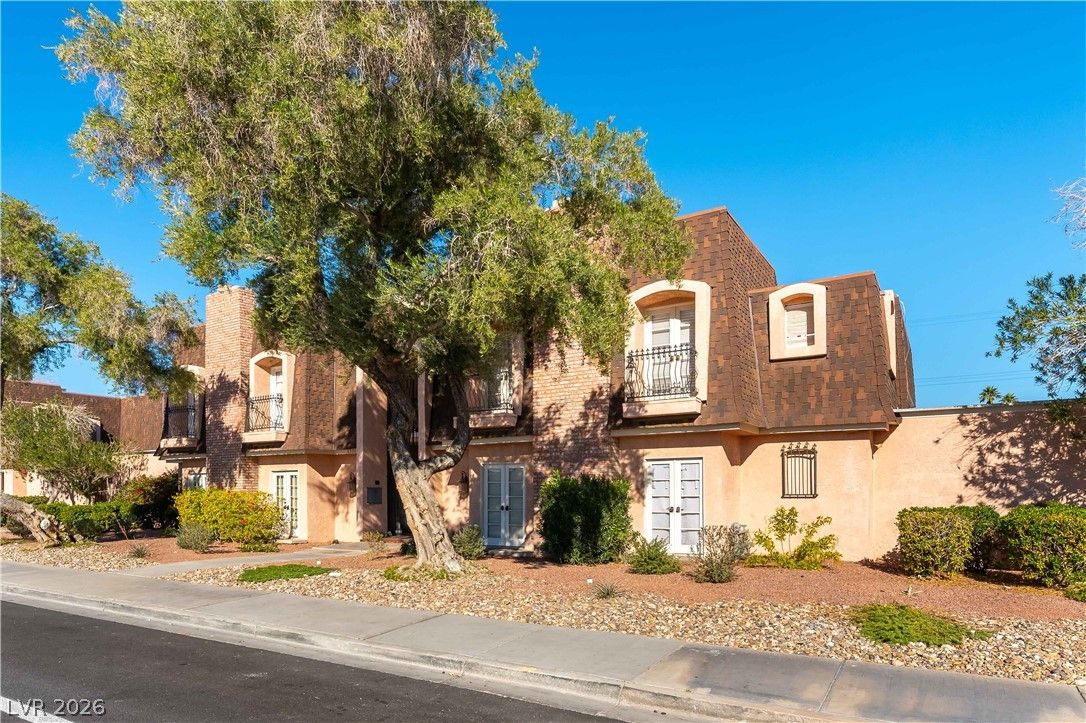
$245,0003 bd2 ba1,554 sqft$158/sqft0.59 mi33 days
Nearest comparable sales and listings
12 comparables · median price $400,000 · range $225,000 – $745,000 · median $/sq ft $285 · average $/sq ft $296
| Address | Status | Price | $/Sq Ft | Bd / Ba | Sq Ft | Sold / market time | Distance |
|---|---|---|---|---|---|---|---|
| 2965 Bel Air Drive | Sold | $460,000 | $352 | 2 / 2 | 1,305 | Sold 2026-07-31 | 0.30 mi |
| 2985 Bel Air Drive | Active | $455,000 | $374 | 3 / 2 | 1,215 | 91 days on market | 0.32 mi |
| 2989 Bel Air Drive | Active | $585,000 | $448 | 2 / 3 | 1,305 | 101 days on market | 0.33 mi |
| 3045 Pinehurst Drive B | Active | $299,000 | $249 | 2 / 2 | 1,200 | 61 days on market | 0.39 mi |
| 3031 East Bel Air Drive | Active | $539,900 | $323 | 3 / 3 | 1,672 | 41 days on market | 0.39 mi |
| 3043 Bel Air Drive | Active | $489,900 | $292 | 2 / 2 | 1,678 | 25 days on market | 0.41 mi |
| 746 Oakmont Avenue 703 | Sold | $225,000 | $205 | 2 / 1 | 1,099 | Sold 2026-06-18 | 0.45 mi |
| 2312 Beverly Way | Sold | $345,000 | $278 | 3 / 2 | 1,240 | Sold 2026-07-31 | 0.56 mi |
| 3161 Bel Air Drive | Sold | $745,000 | $446 | 3 / 3 | 1,672 | Sold 2026-06-25 | 0.57 mi |
| 1301 East St Louis Avenue C | Active | $245,000 | $158 | 3 / 2 | 1,554 | 33 days on market | 0.59 mi |
| 1409 East St Louis Avenue A | Active | $265,000 | $171 | 2 / 2 | 1,554 | 202 days on market | 0.63 mi |
| 2216 Santa Ynez Drive | Active | $325,000 | $261 | 3 / 2 | 1,246 | 131 days on market | 0.67 mi |


