
Comparable Sales Near 7490 Lush Oasis Avenue, Las Vegas, NV 89113
1st Realty · Comparable sales report · 1st.estate · October 20, 2026
Read the Enterprise neighborhood guide →
7490 Lush Oasis Avenue, Las Vegas, NV 89113
Status: Sold
$2,395 Sold Price
$1
$ / Sq Ft
1,852
Living Area
6,098 sqft
Lot Size
3
Beds
3
Baths
2021
Year Built
Search Parameters
Property Type
Status
Radius
Sold Within
Beds
Baths
Living Area (Sq Ft)
Lot Size (Sq Ft)
This comp search reflects your current search parameters — adjust the filters above as needed for a more accurate estimate.
Estimated Value
—
Average $/Sqft
—
Check one or more comps below to calculate an estimate.
Nearest 10 of 20 comparable sales and listings within 1 mile of this home. Use the filters above and press Search to refine.
$499,9003 bd2 ba1,701 sqft$294/sqft0.24 mi80 daysSold 2026-06-25

7471 Burnt Oak AvenueActive
$495,0003 bd2 ba1,536 sqft$322/sqft0.38 mi0 days
$450,0003 bd2 ba1,434 sqft$314/sqft0.39 mi4 daysSold 2026-06-08
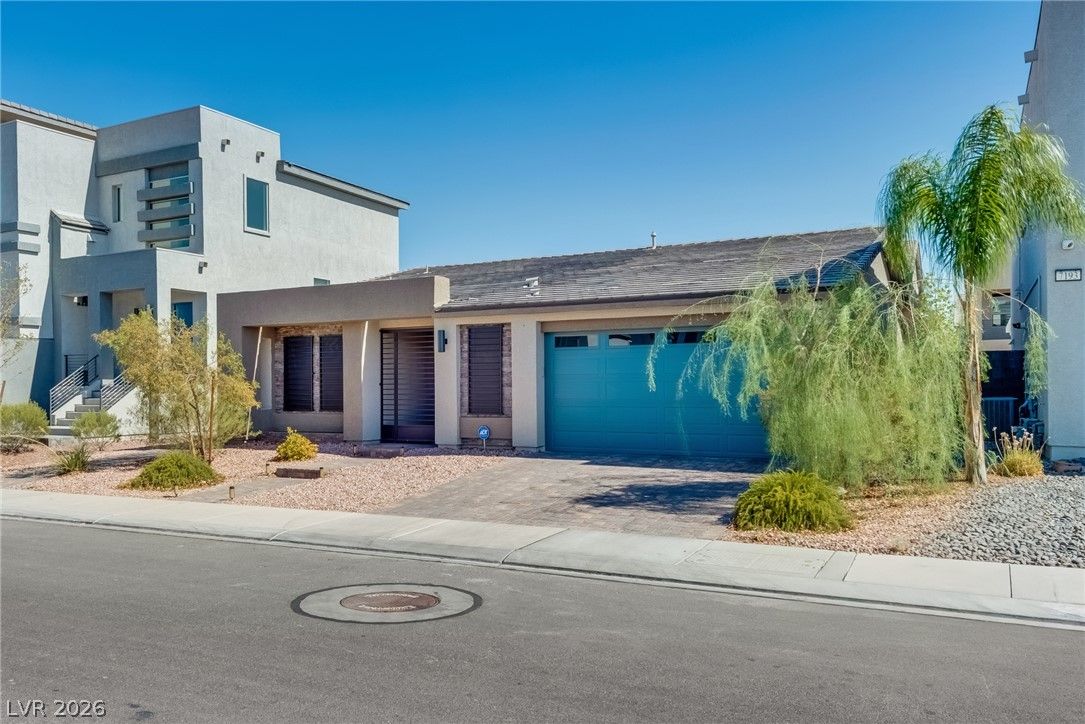
7177 West Camero AvenueActive
$698,8803 bd2 ba2,212 sqft$316/sqft0.40 mi60 days
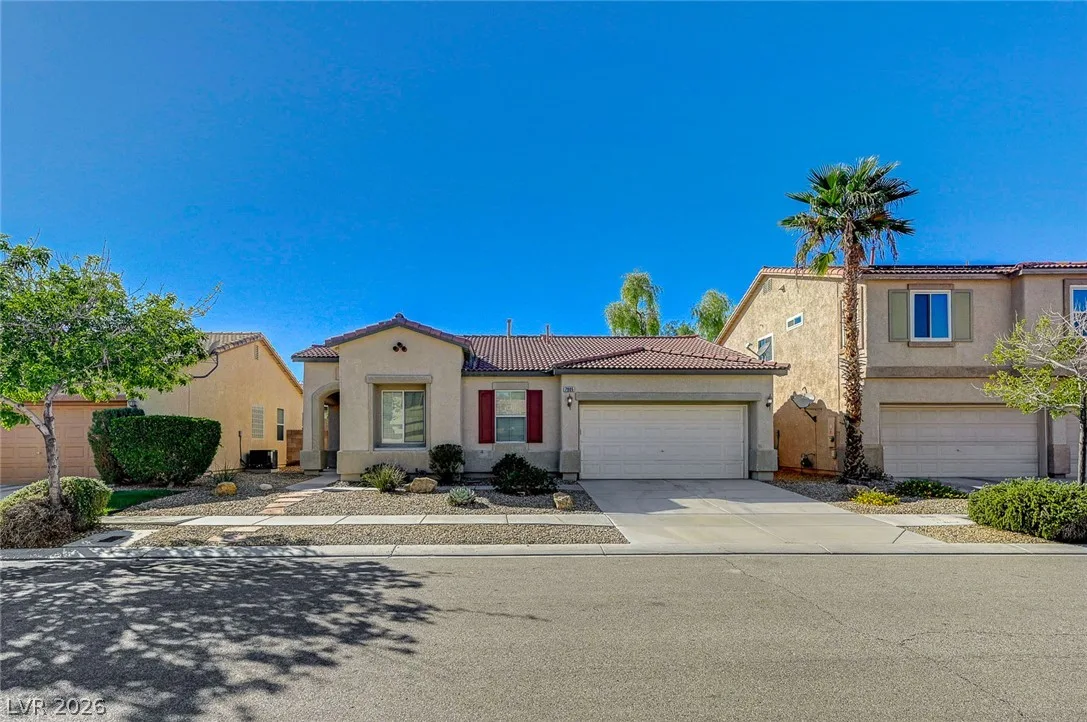
$448,0003 bd2 ba1,434 sqft$312/sqft0.41 mi0 days
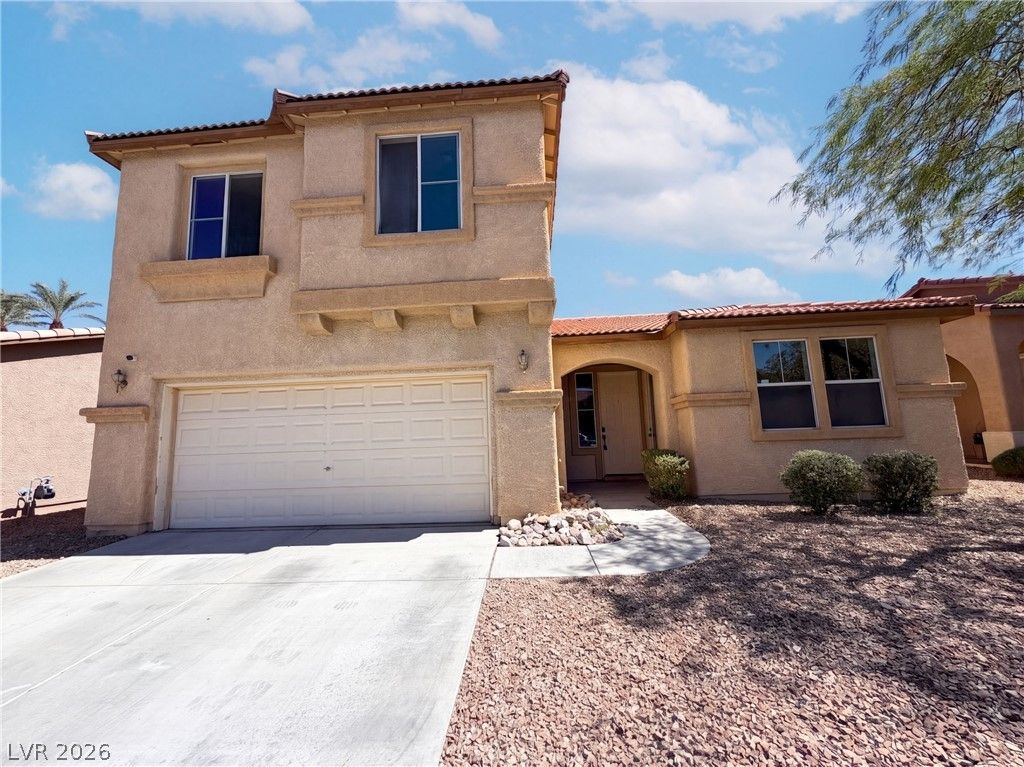
$469,0003 bd3 ba1,950 sqft$241/sqft0.44 mi20 days
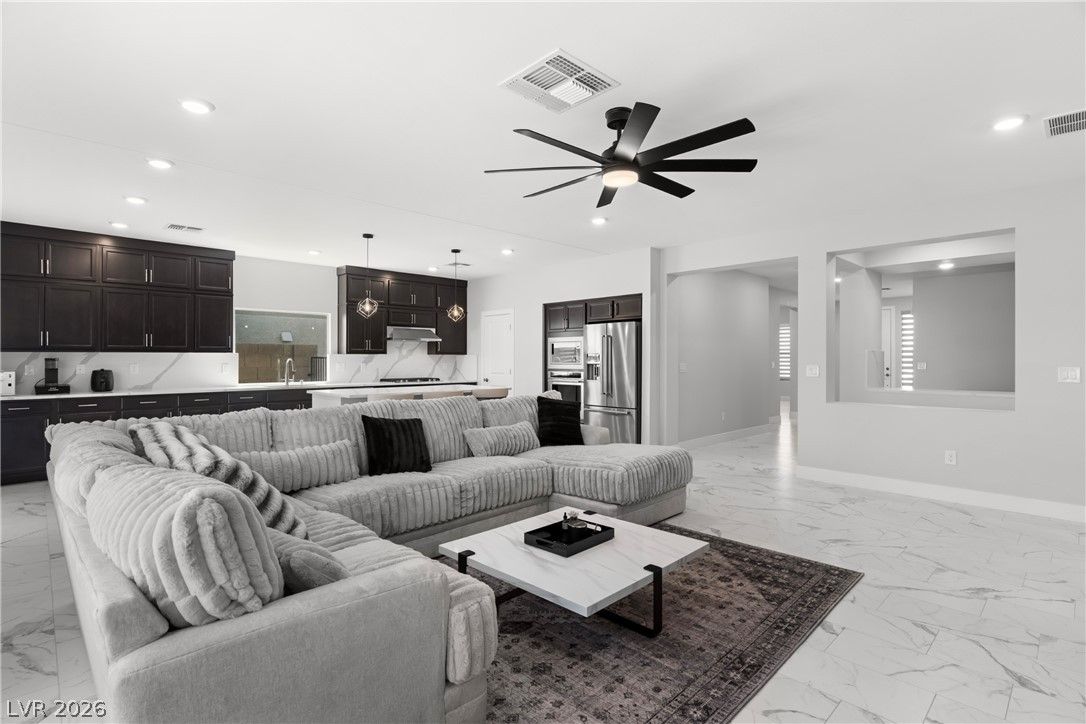
7142 Bold Rock AvenueActive
$699,0003 bd2 ba2,212 sqft$316/sqft0.46 mi18 days
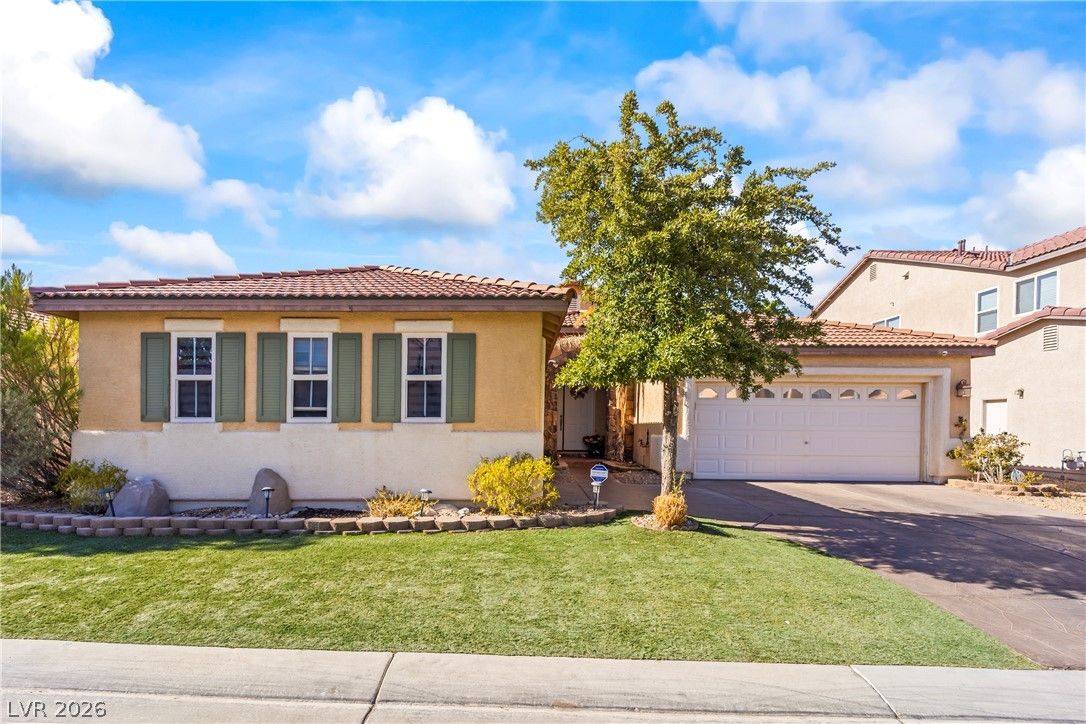
$569,9003 bd2 ba2,007 sqft$284/sqft0.62 mi57 days
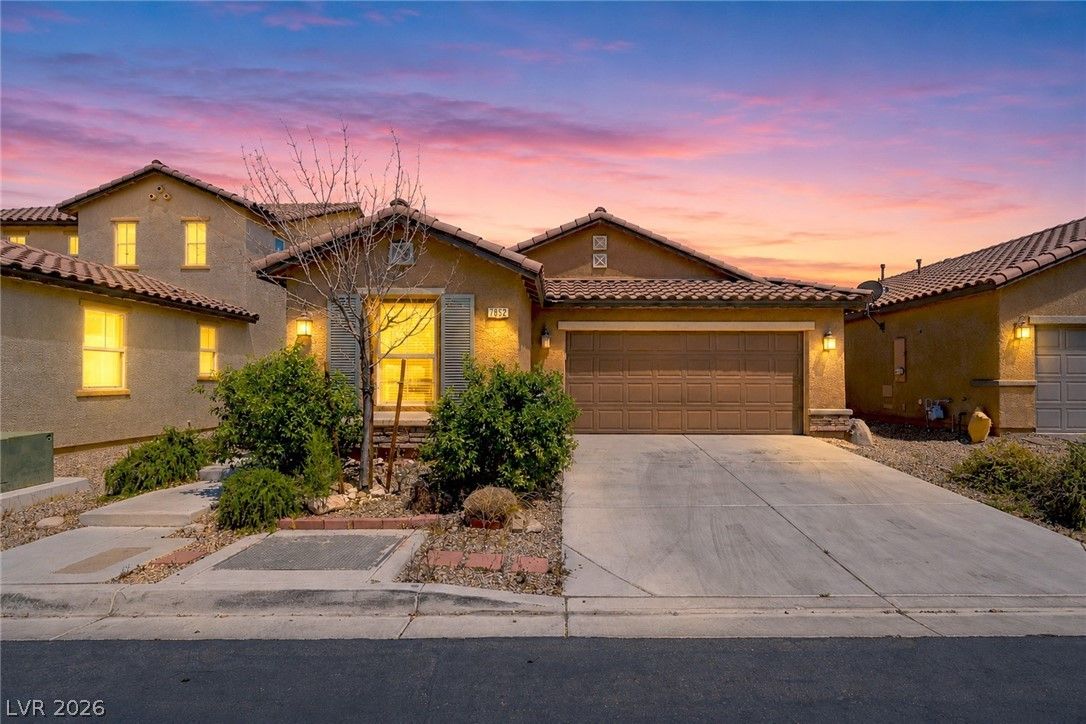
7852 Hamilton Pool DriveActive
$525,0003 bd2 ba1,844 sqft$285/sqft0.65 mi97 days
$530,0003 bd3 ba1,852 sqft$286/sqft0.70 mi73 daysSold 2026-05-15
Nearest comparable sales and listings
12 comparables · median price $512,450 · range $436,900 – $699,000 · median $/sq ft $290 · average $/sq ft $292
| Address | Status | Price | $/Sq Ft | Bd / Ba | Sq Ft | Sold / market time | Distance |
|---|---|---|---|---|---|---|---|
| 7621 Port Orchard Avenue | Sold | $499,900 | $294 | 3 / 2 | 1,701 | Sold 2026-06-25 | 0.24 mi |
| 7471 Burnt Oak Avenue | Active | $495,000 | $322 | 3 / 2 | 1,536 | 0 days on market | 0.38 mi |
| 7955 Prairie River Street | Sold | $450,000 | $314 | 3 / 2 | 1,434 | Sold 2026-06-08 | 0.39 mi |
| 7177 West Camero Avenue | Active | $698,880 | $316 | 3 / 2 | 2,212 | 60 days on market | 0.40 mi |
| 7905 Sagebrush Bend Street | Active | $448,000 | $312 | 3 / 2 | 1,434 | 0 days on market | 0.41 mi |
| 7878 Mohican Canyon Street | Active | $469,000 | $241 | 3 / 3 | 1,950 | 20 days on market | 0.44 mi |
| 7142 Bold Rock Avenue | Active | $699,000 | $316 | 3 / 2 | 2,212 | 18 days on market | 0.46 mi |
| 7364 South Brushwood Peak Avenue | Active | $569,900 | $284 | 3 / 2 | 2,007 | 57 days on market | 0.62 mi |
| 7852 Hamilton Pool Drive | Active | $525,000 | $285 | 3 / 2 | 1,844 | 97 days on market | 0.65 mi |
| 8659 Vermont Vista Street | Sold | $530,000 | $286 | 3 / 3 | 1,852 | Sold 2026-05-15 | 0.70 mi |
| 7608 Stray Horse Avenue | Active | $568,000 | $250 | 4 / 3 | 2,270 | 68 days on market | 0.86 mi |
| 7466 Stray Horse Avenue | Sold | $436,900 | $285 | 3 / 2 | 1,535 | Sold 2026-05-28 | 0.86 mi |


