
Comparable Sales Near 2625 BEGONIA FALLS Avenue 84, North Las Vegas, NV 89081
1st Realty · Comparable sales report · 1st.estate · October 20, 2026
Read the North Las Vegas area guide →
2625 BEGONIA FALLS Avenue 84, North Las Vegas, NV 89081
Status: Sold
$441,990 Sold Price
$237
$ / Sq Ft
1,865
Living Area
3,045 sqft
Lot Size
4
Beds
3
Baths
2025
Year Built
Search Parameters
Property Type
Status
Radius
Sold Within
Beds
Baths
Living Area (Sq Ft)
Lot Size (Sq Ft)
This comp search reflects your current search parameters — adjust the filters above as needed for a more accurate estimate.
Estimated Value
—
Average $/Sqft
—
Check one or more comps below to calculate an estimate.
Nearest 10 of 13 comparable sales and listings within 1 mile of this home. Use the filters above and press Search to refine.
$415,0005 bd3 ba2,123 sqft$195/sqft0.42 mi11 daysSold 2026-06-12
$372,5004 bd3 ba1,788 sqft$208/sqft0.46 mi46 daysSold 2026-06-29
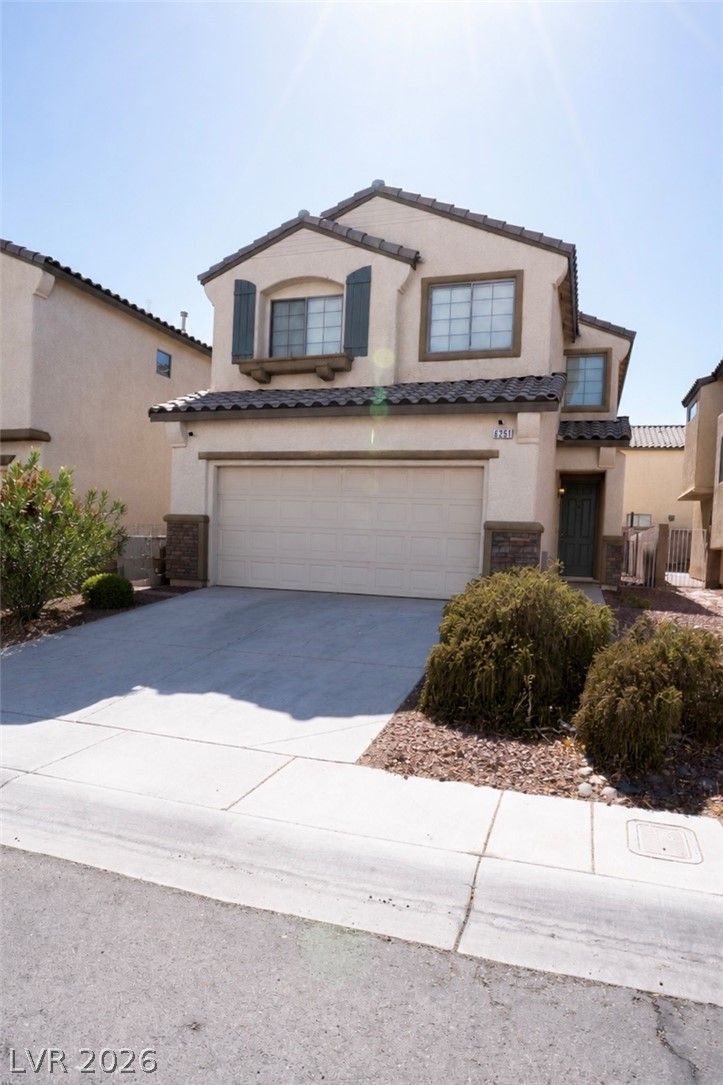
6251 Copper Light StreetActive
$389,0005 bd3 ba2,123 sqft$183/sqft0.50 mi83 days
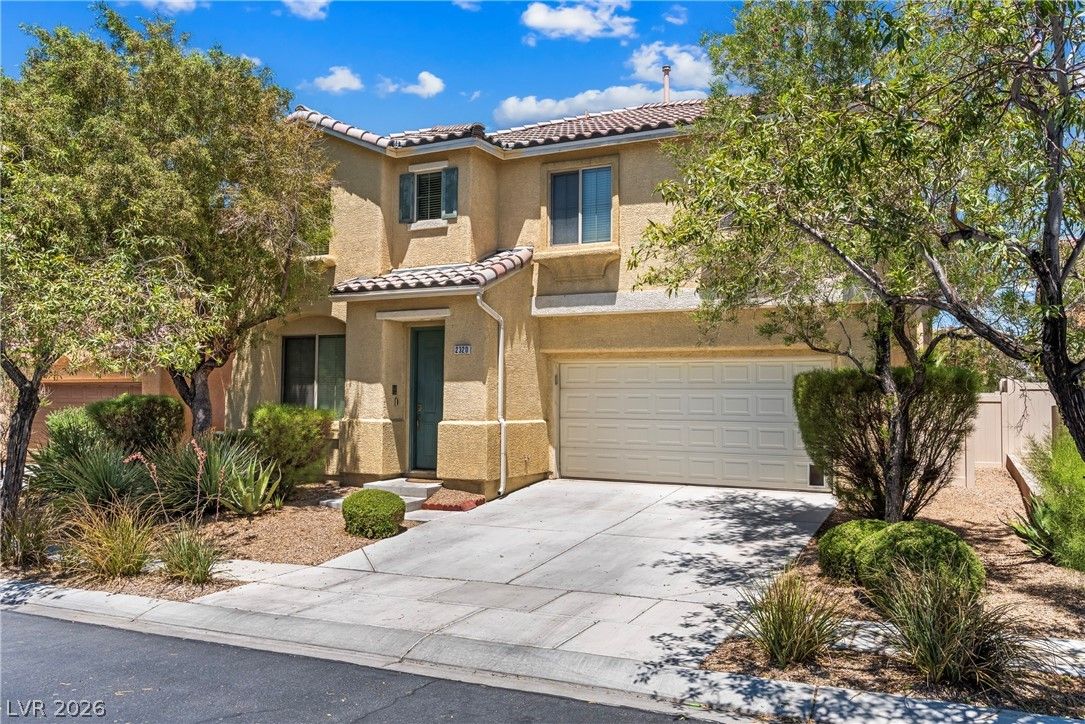
2320 Farm Bridge AvenueActive
$415,0004 bd3 ba2,316 sqft$179/sqft0.67 mi146 days
$405,0004 bd3 ba2,043 sqft$198/sqft0.78 mi6 daysSold 2026-04-27
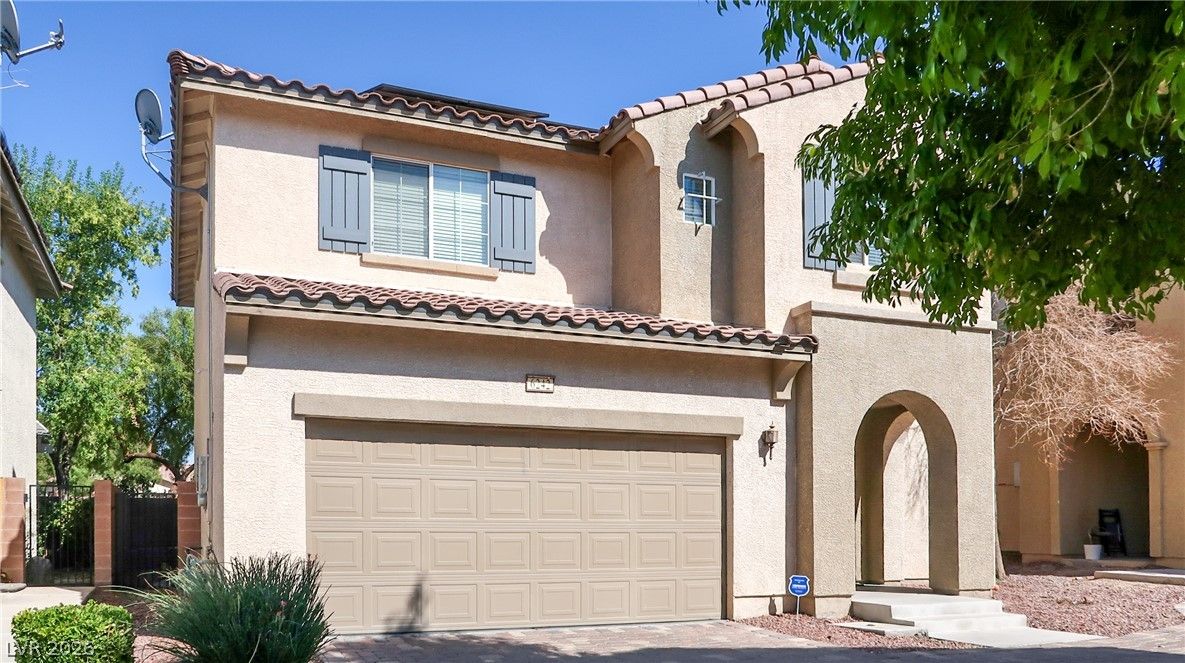
6242 Standing Elm StreetActive
$345,0003 bd3 ba1,595 sqft$216/sqft0.80 mi66 days
$405,0003 bd3 ba1,795 sqft$226/sqft0.81 mi4 daysSold 2026-05-15
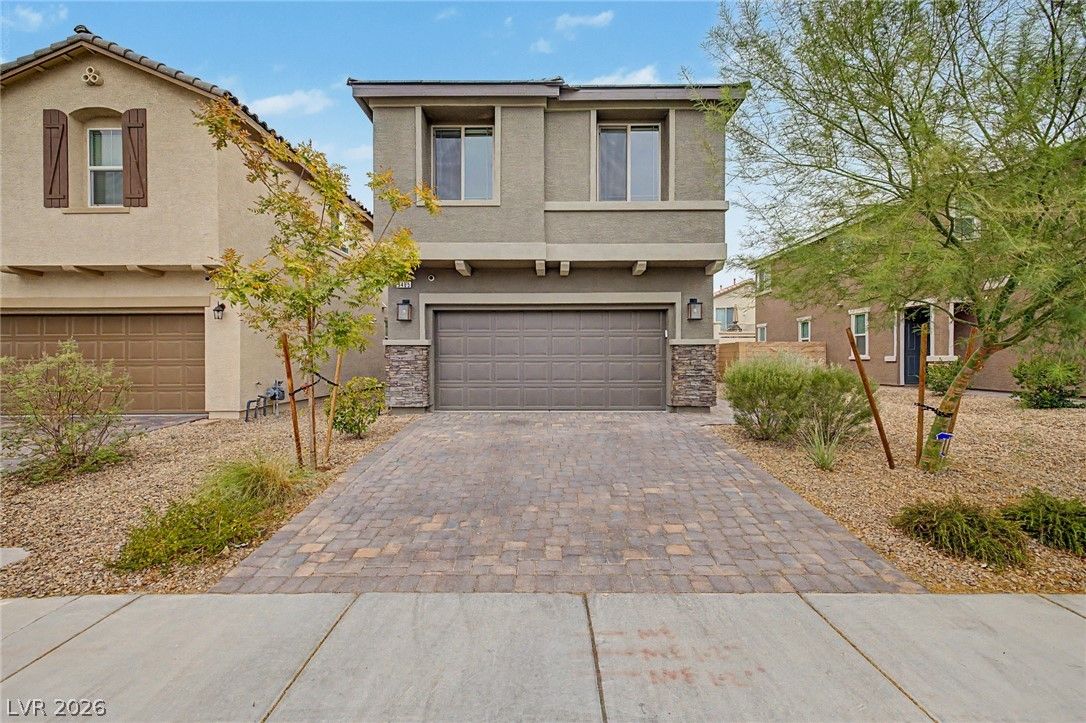
3405 Cromford DriveActive
$410,0003 bd3 ba1,795 sqft$228/sqft0.82 mi59 days
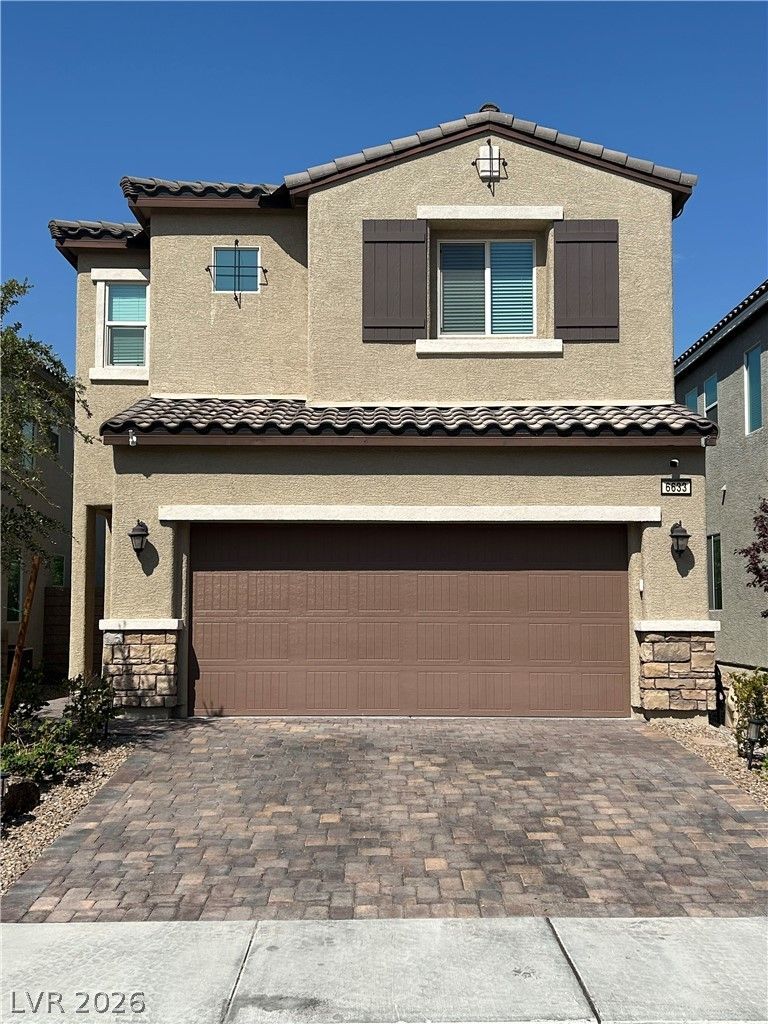
6633 West Evander StreetActive
$419,9903 bd3 ba1,657 sqft$253/sqft0.82 mi41 days
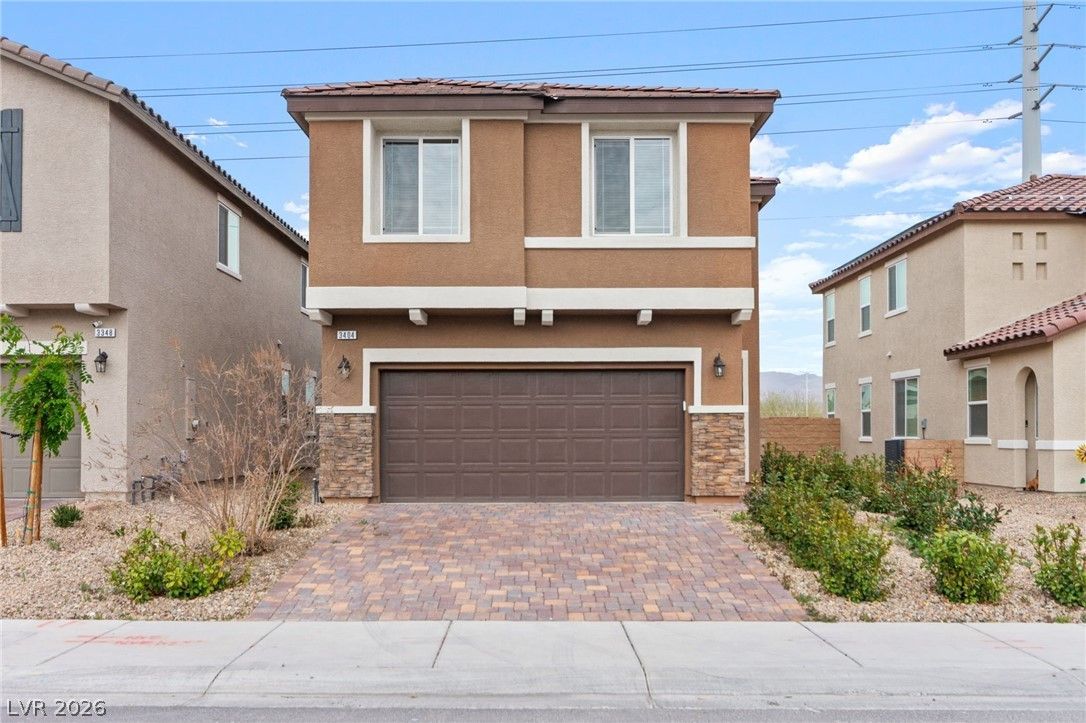
$410,0003 bd3 ba1,795 sqft$228/sqft0.87 mi170 daysSold 2026-09-10
Nearest comparable sales and listings
12 comparables · median price $407,500 · range $345,000 – $421,000 · median $/sq ft $221 · average $/sq ft $217
| Address | Status | Price | $/Sq Ft | Bd / Ba | Sq Ft | Sold / market time | Distance |
|---|---|---|---|---|---|---|---|
| 3021 Austin Pale Avenue | Sold | $415,000 | $195 | 5 / 3 | 2,123 | Sold 2026-06-12 | 0.42 mi |
| 3042 Austin Pale Avenue | Sold | $372,500 | $208 | 4 / 3 | 1,788 | Sold 2026-06-29 | 0.46 mi |
| 6251 Copper Light Street | Active | $389,000 | $183 | 5 / 3 | 2,123 | 83 days on market | 0.50 mi |
| 2320 Farm Bridge Avenue | Active | $415,000 | $179 | 4 / 3 | 2,316 | 146 days on market | 0.67 mi |
| 3409 Edinboro Ridge Avenue | Sold | $405,000 | $198 | 4 / 3 | 2,043 | Sold 2026-04-27 | 0.78 mi |
| 6242 Standing Elm Street | Active | $345,000 | $216 | 3 / 3 | 1,595 | 66 days on market | 0.80 mi |
| 3339 Cromford Drive | Sold | $405,000 | $226 | 3 / 3 | 1,795 | Sold 2026-05-15 | 0.81 mi |
| 3405 Cromford Drive | Active | $410,000 | $228 | 3 / 3 | 1,795 | 59 days on market | 0.82 mi |
| 6633 West Evander Street | Active | $419,990 | $253 | 3 / 3 | 1,657 | 41 days on market | 0.82 mi |
| 3404 Castlefields Drive | Sold | $410,000 | $228 | 3 / 3 | 1,795 | Sold 2026-09-10 | 0.87 mi |
| 1239 Appaloosa Hills Avenue | Active | $365,000 | $229 | 3 / 3 | 1,595 | 0 days on market | 0.88 mi |
| 6710 High Quest Street | Sold | $421,000 | $256 | 3 / 3 | 1,646 | Sold 2026-05-07 | 0.90 mi |


