
Comparable Sales Near 8300 Bermuda Beach Drive, Las Vegas, NV 89128
1st Realty · Comparable sales report · 1st.estate · October 20, 2026
Browse our Las Vegas area guides →
8300 Bermuda Beach Drive, Las Vegas, NV 89128
Status: Sold
$2,400 Sold Price
$1
$ / Sq Ft
1,773
Living Area
4,356 sqft
Lot Size
3
Beds
3
Baths
1990
Year Built
Search Parameters
Property Type
Status
Radius
Sold Within
Beds
Baths
Living Area (Sq Ft)
Lot Size (Sq Ft)
This comp search reflects your current search parameters — adjust the filters above as needed for a more accurate estimate.
Estimated Value
—
Average $/Sqft
—
Check one or more comps below to calculate an estimate.
Nearest 10 of 36 comparable sales and listings within 1 mile of this home. Use the filters above and press Search to refine.
$545,0004 bd3 ba2,079 sqft$262/sqft0.12 mi10 daysSold 2026-05-29
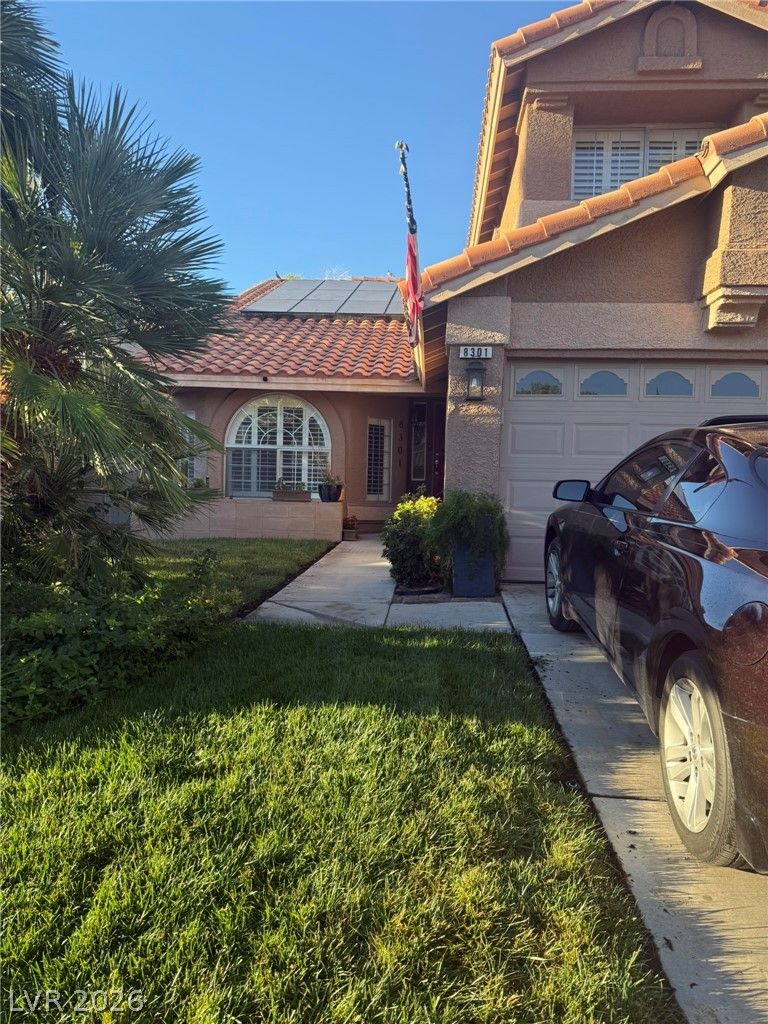
8301 Hollow Wharf DriveUnder Contract
$450,0004 bd3 ba2,079 sqft$216/sqft0.13 mi10 days
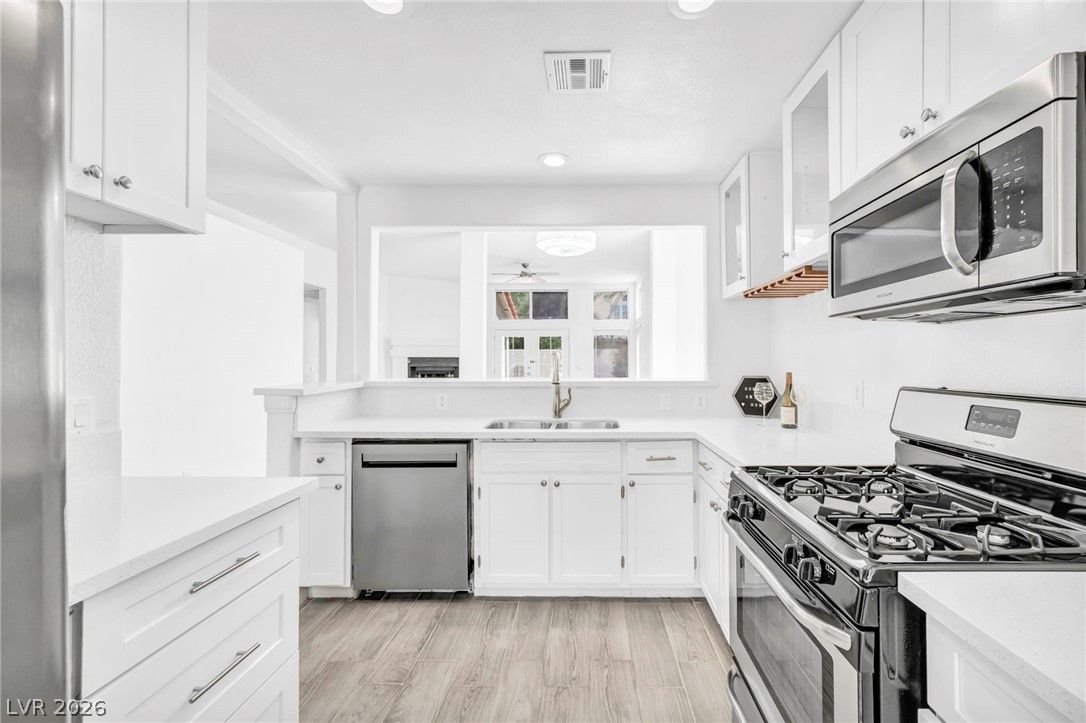
$439,0003 bd3 ba1,537 sqft$286/sqft0.15 mi125 days

2329 Homeland StreetActive
$534,0004 bd3 ba1,929 sqft$277/sqft0.24 mi13 days
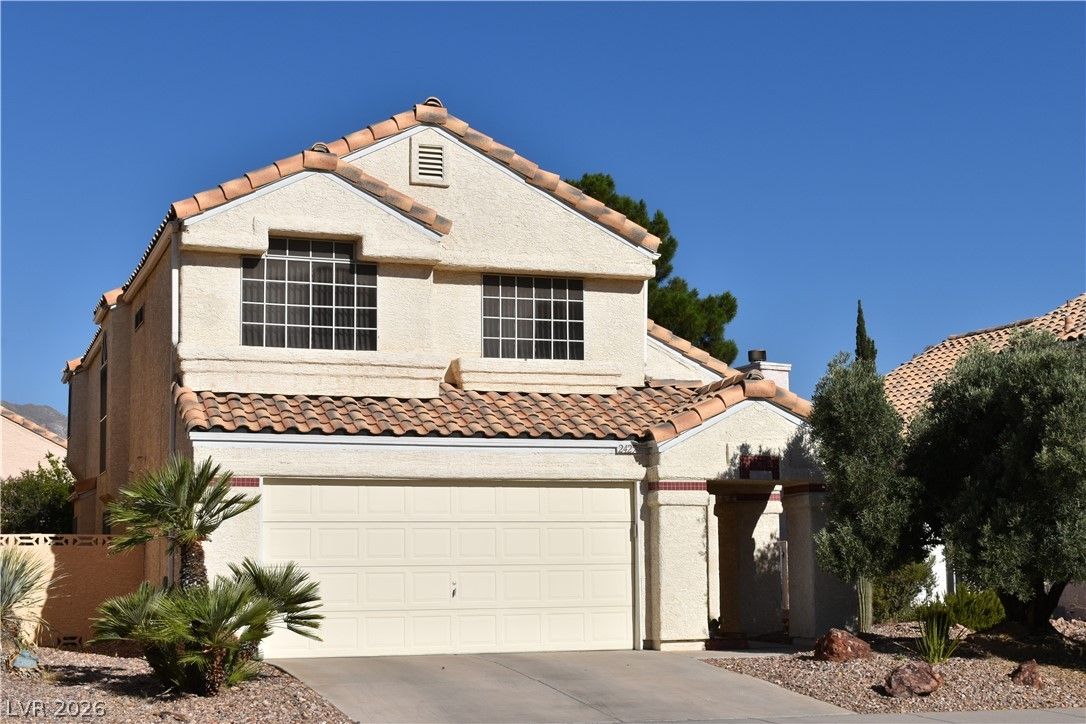
$450,0003 bd3 ba1,793 sqft$251/sqft0.27 mi70 daysSold 2026-09-15

8332 Shore Breeze DriveActive
$549,9003 bd3 ba1,597 sqft$344/sqft0.32 mi0 days

2441 Sage Pointe CircleActive
$489,0003 bd3 ba1,597 sqft$306/sqft0.33 mi54 days
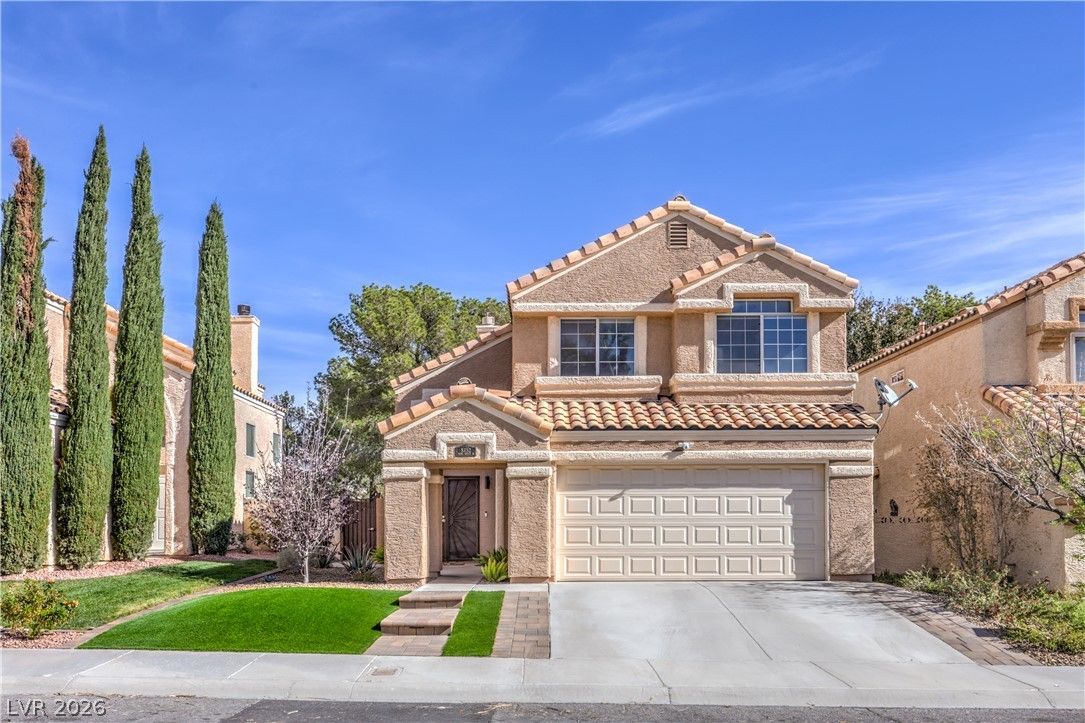
$527,0003 bd3 ba1,793 sqft$294/sqft0.35 mi46 daysSold 2026-08-27
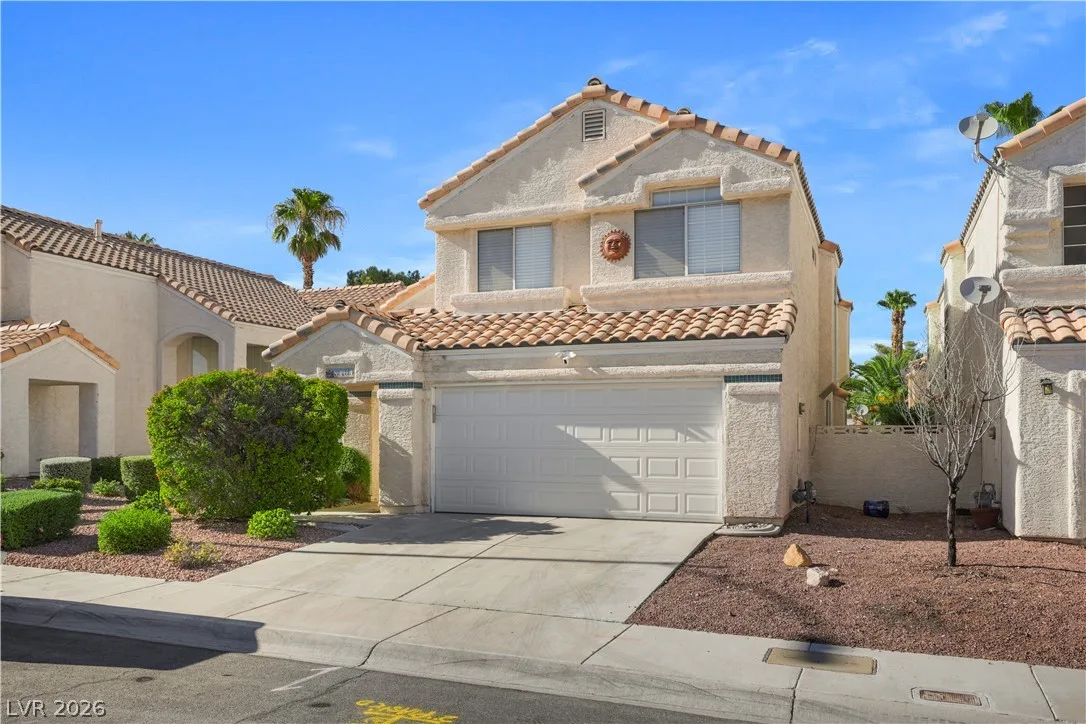
$420,0003 bd4 ba1,793 sqft$234/sqft0.36 mi3 daysSold 2026-09-08
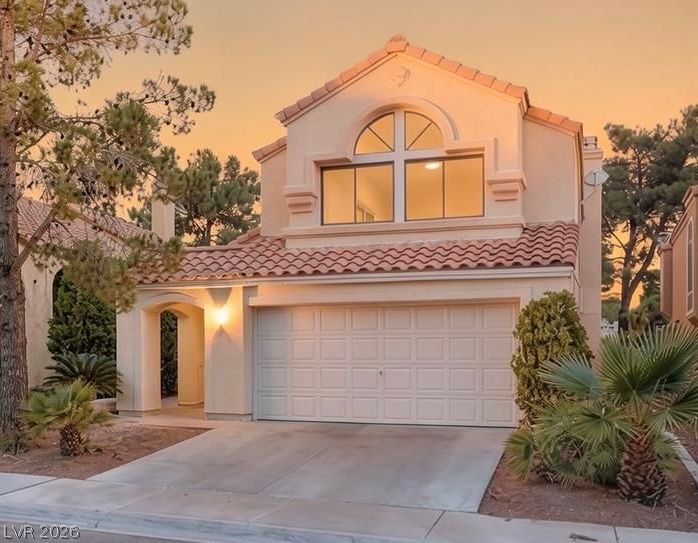
8404 Shore Breeze DriveActive
$565,5004 bd3 ba1,928 sqft$293/sqft0.40 mi52 days
Nearest comparable sales and listings
12 comparables · median price $506,950 · range $420,000 – $565,500 · median $/sq ft $269 · average $/sq ft $273
| Address | Status | Price | $/Sq Ft | Bd / Ba | Sq Ft | Sold / market time | Distance |
|---|---|---|---|---|---|---|---|
| 8324 Hollow Wharf Drive | Sold | $545,000 | $262 | 4 / 3 | 2,079 | Sold 2026-05-29 | 0.12 mi |
| 8301 Hollow Wharf Drive | Under Contract | $450,000 | $216 | 4 / 3 | 2,079 | 10 days on market | 0.13 mi |
| 2124 Brighton Shore Street | Active | $439,000 | $286 | 3 / 3 | 1,537 | 125 days on market | 0.15 mi |
| 2329 Homeland Street | Active | $534,000 | $277 | 4 / 3 | 1,929 | 13 days on market | 0.24 mi |
| 2425 Palm Shore Court | Sold | $450,000 | $251 | 3 / 3 | 1,793 | Sold 2026-09-15 | 0.27 mi |
| 8332 Shore Breeze Drive | Active | $549,900 | $344 | 3 / 3 | 1,597 | 0 days on market | 0.32 mi |
| 2441 Sage Pointe Circle | Active | $489,000 | $306 | 3 / 3 | 1,597 | 54 days on market | 0.33 mi |
| 8352 SHORE BREEZE Drive | Sold | $527,000 | $294 | 3 / 3 | 1,793 | Sold 2026-08-27 | 0.35 mi |
| 8404 Shady Shores Circle | Sold | $420,000 | $234 | 3 / 4 | 1,793 | Sold 2026-09-08 | 0.36 mi |
| 8404 Shore Breeze Drive | Active | $565,500 | $293 | 4 / 3 | 1,928 | 52 days on market | 0.40 mi |
| 7836 Turtle Cove Avenue | Active | $524,900 | $258 | 4 / 3 | 2,035 | 168 days on market | 0.45 mi |
| 7821 Millhopper Avenue | Active | $459,900 | $250 | 3 / 3 | 1,841 | 24 days on market | 0.49 mi |


