
Comparable Sales Near 2595 Amber Crest Street, Las Vegas, NV 89142
1st Realty · Comparable sales report · 1st.estate · October 21, 2026
Browse our Las Vegas area guides →
2595 Amber Crest Street, Las Vegas, NV 89142
Status: Sold
$350,000 Sold Price
$278
$ / Sq Ft
1,261
Living Area
5,227 sqft
Lot Size
3
Beds
2
Baths
2001
Year Built
Search Parameters
Property Type
Status
Radius
Sold Within
Beds
Baths
Living Area (Sq Ft)
Lot Size (Sq Ft)
This comp search reflects your current search parameters — adjust the filters above as needed for a more accurate estimate.
Estimated Value
—
Average $/Sqft
—
Check one or more comps below to calculate an estimate.
Nearest 10 of 31 comparable sales and listings within 1 mile of this home. Use the filters above and press Search to refine.
$344,2504 bd2 ba1,521 sqft$226/sqft0.09 mi20 daysSold 2026-05-01
$380,0004 bd2 ba1,521 sqft$250/sqft0.11 mi1 daysSold 2026-05-18
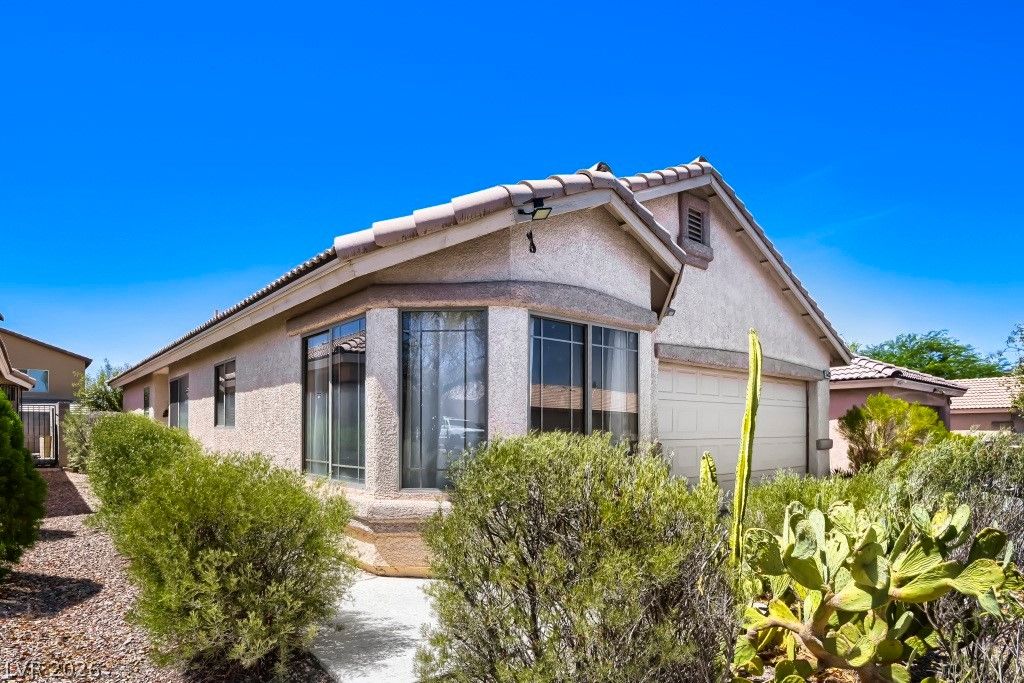
$339,0003 bd2 ba1,514 sqft$224/sqft0.12 mi13 daysSold 2026-08-31
$319,0002 bd2 ba1,173 sqft$272/sqft0.14 mi62 daysSold 2026-05-14
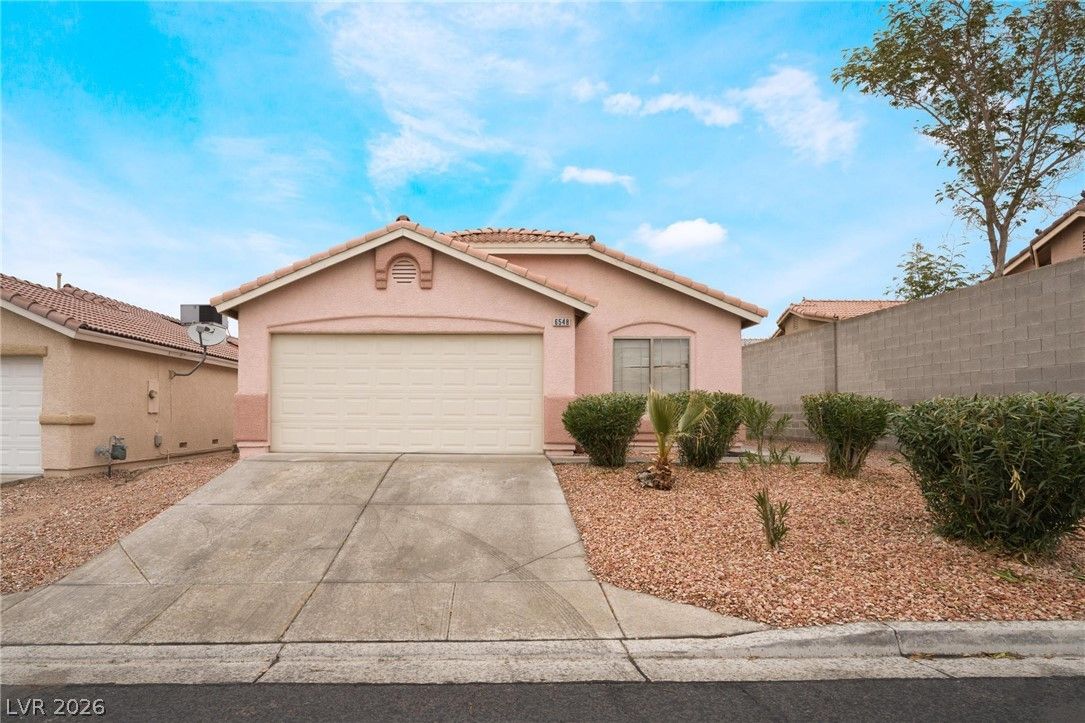
6548 Shining Sand AvenueActive
$379,0004 bd2 ba1,521 sqft$249/sqft0.19 mi1 days
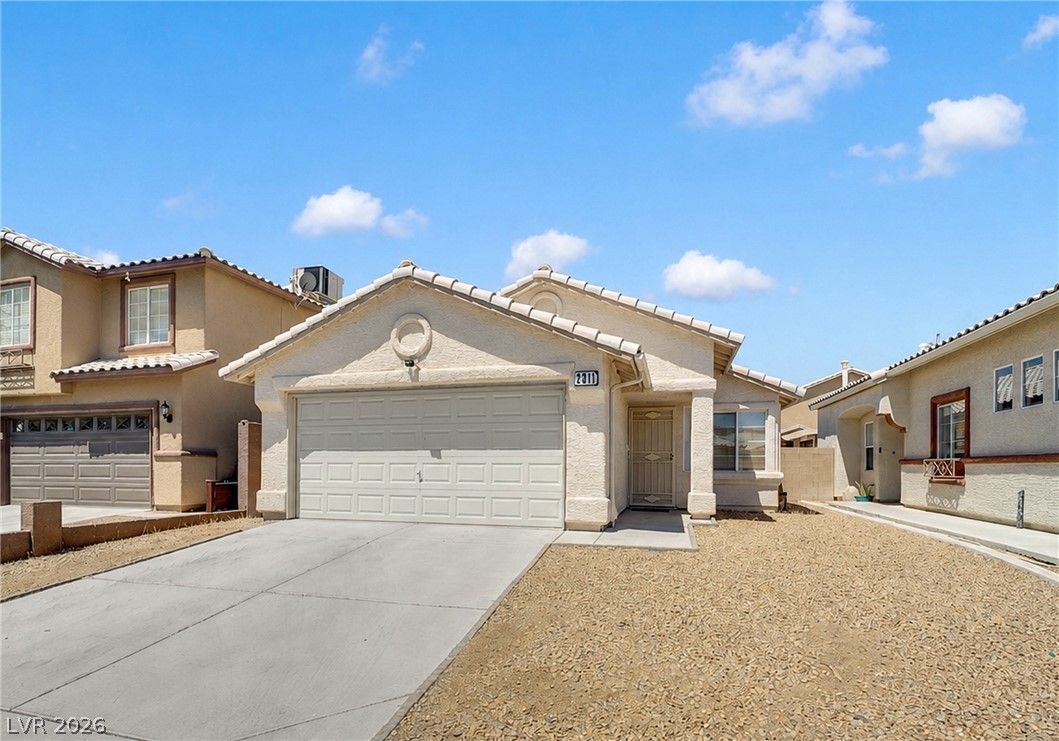
$355,0002 bd2 ba1,195 sqft$297/sqft0.53 mi7 daysSold 2026-08-25
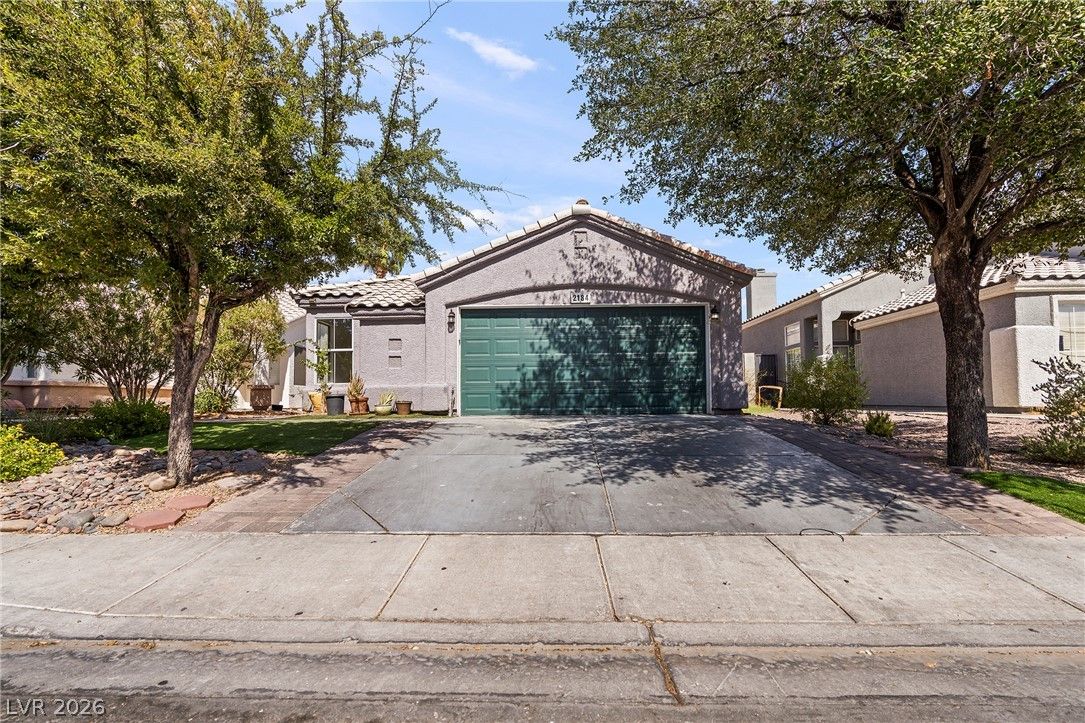
$375,0003 bd2 ba1,311 sqft$286/sqft0.62 mi40 daysSold 2026-09-30
$340,0002 bd2 ba1,051 sqft$324/sqft0.71 mi13 daysSold 2026-05-04
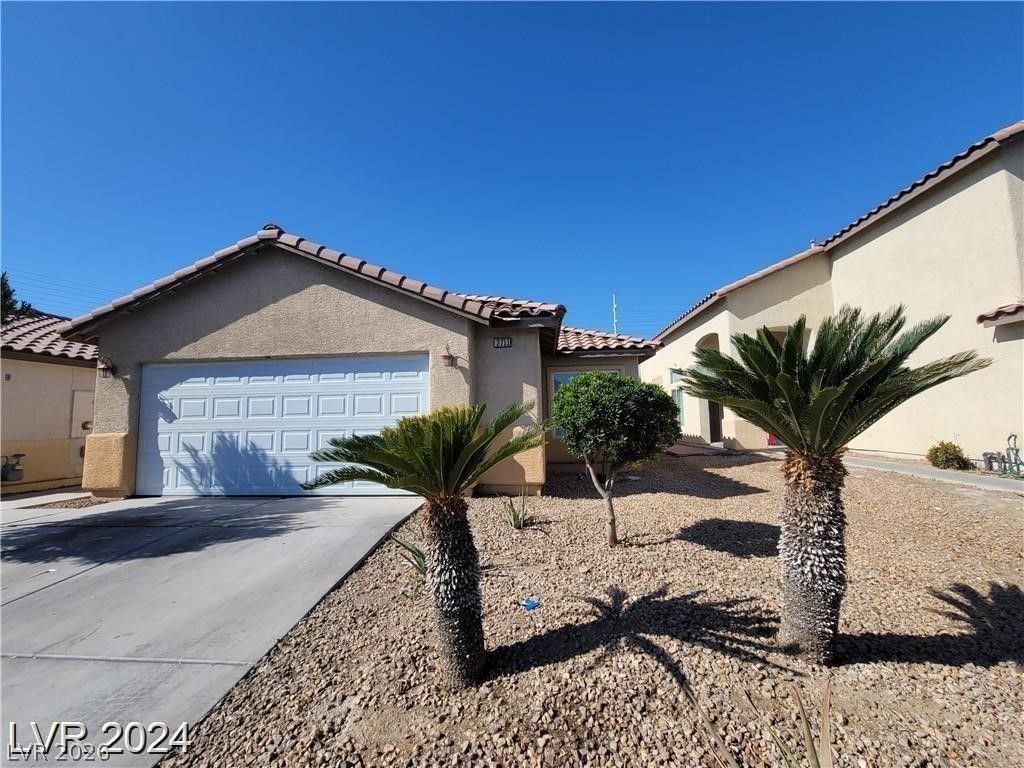
2711 Morning Break CourtActive
$394,9003 bd2 ba1,334 sqft$296/sqft0.77 mi0 days
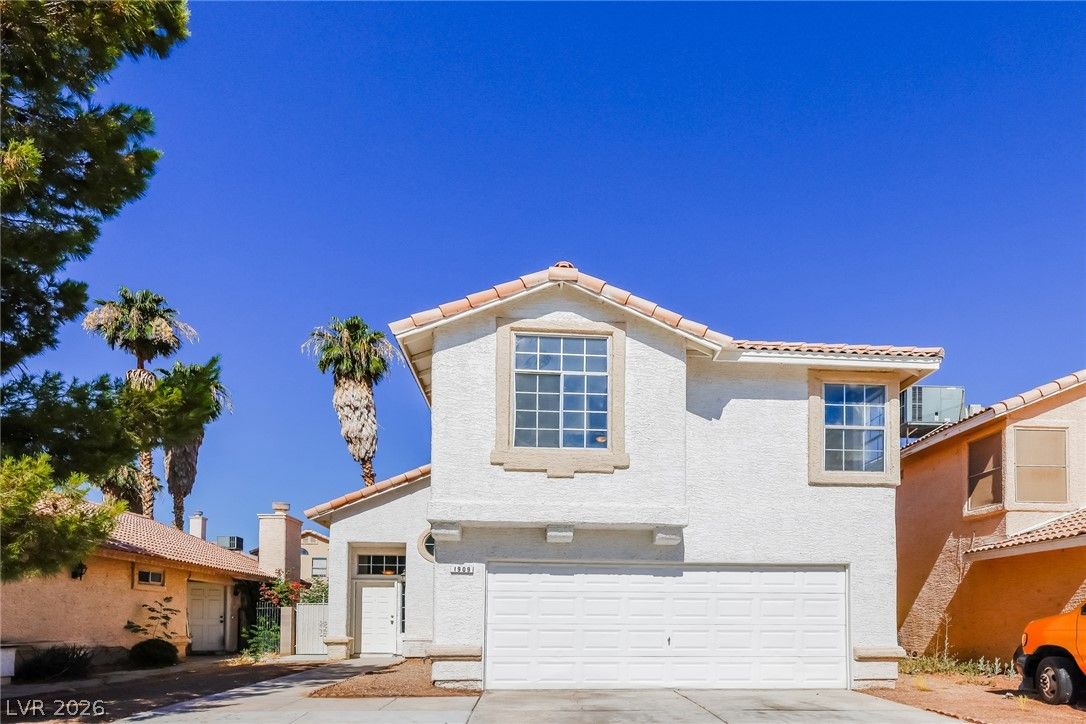
1909 Dry Falls StreetUnder Contract
$377,4004 bd3 ba1,542 sqft$245/sqft0.80 mi99 days
Nearest comparable sales and listings
12 comparables · median price $349,625 · range $319,000 – $394,900 · median $/sq ft $268 · average $/sq ft $267
| Address | Status | Price | $/Sq Ft | Bd / Ba | Sq Ft | Sold / market time | Distance |
|---|---|---|---|---|---|---|---|
| 2549 Rosy Sunrise Street | Sold | $344,250 | $226 | 4 / 2 | 1,521 | Sold 2026-05-01 | 0.09 mi |
| 6413 Shining Sand Avenue | Sold | $380,000 | $250 | 4 / 2 | 1,521 | Sold 2026-05-18 | 0.11 mi |
| 6431 Shining Sand Avenue | Sold | $339,000 | $224 | 3 / 2 | 1,514 | Sold 2026-08-31 | 0.12 mi |
| 6328 Angelita View Avenue | Sold | $319,000 | $272 | 2 / 2 | 1,173 | Sold 2026-05-14 | 0.14 mi |
| 6548 Shining Sand Avenue | Active | $379,000 | $249 | 4 / 2 | 1,521 | 1 days on market | 0.19 mi |
| 2311 Red Crossbill Lane | Sold | $355,000 | $297 | 2 / 2 | 1,195 | Sold 2026-08-25 | 0.53 mi |
| 2184 Raspberry Hill Road | Sold | $375,000 | $286 | 3 / 2 | 1,311 | Sold 2026-09-30 | 0.62 mi |
| 5921 Sunrise Hills Drive | Sold | $340,000 | $324 | 2 / 2 | 1,051 | Sold 2026-05-04 | 0.71 mi |
| 2711 Morning Break Court | Active | $394,900 | $296 | 3 / 2 | 1,334 | 0 days on market | 0.77 mi |
| 1909 Dry Falls Street | Under Contract | $377,400 | $245 | 4 / 3 | 1,542 | 99 days on market | 0.80 mi |
| 1950 Turtlerock Street | Sold | $331,000 | $277 | 2 / 2 | 1,196 | Sold 2026-09-30 | 0.80 mi |
| 5747 Coleridge Way | Sold | $325,000 | $264 | 3 / 2 | 1,230 | Sold 2026-05-12 | 0.84 mi |


