
Comparable Sales Near 8113 Blue Cascade Avenue, Las Vegas, NV 89128
1st Realty · Comparable sales report · 1st.estate · October 21, 2026
Browse our Las Vegas area guides →
8113 Blue Cascade Avenue, Las Vegas, NV 89128
Status: Sold
$670,000 Sold Price
$221
$ / Sq Ft
3,025
Living Area
8,276 sqft
Lot Size
5
Beds
4
Baths
1993
Year Built
Search Parameters
Property Type
Status
Radius
Sold Within
Beds
Baths
Living Area (Sq Ft)
Lot Size (Sq Ft)
This comp search reflects your current search parameters — adjust the filters above as needed for a more accurate estimate.
Estimated Value
—
Average $/Sqft
—
Check one or more comps below to calculate an estimate.
Nearest 10 of 45 comparable sales and listings within 1 mile of this home. Use the filters above and press Search to refine.
$700,0004 bd3 ba2,347 sqft$298/sqft0.10 mi109 daysSold 2026-07-20
$645,0004 bd3 ba3,330 sqft$194/sqft0.11 mi43 daysSold 2026-06-03

2117 White Falls StreetUnder Contract
$624,9904 bd3 ba2,347 sqft$266/sqft0.13 mi47 days
$515,0004 bd3 ba2,347 sqft$219/sqft0.16 mi110 daysSold 2026-07-23
$699,9005 bd4 ba3,698 sqft$189/sqft0.18 mi15 daysSold 2026-06-15

8217 Ocean Terrace WayActive
$549,9994 bd3 ba3,099 sqft$177/sqft0.21 mi166 days
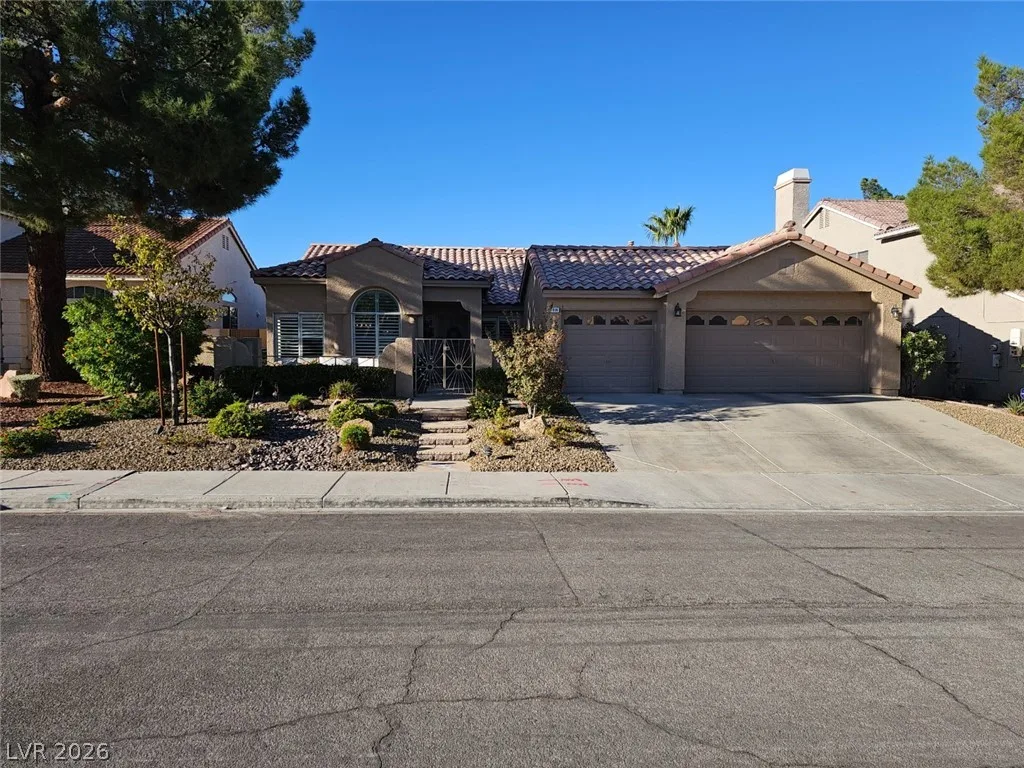
7908 Waterfalls AvenueActive
$664,9004 bd3 ba2,347 sqft$283/sqft0.22 mi0 days
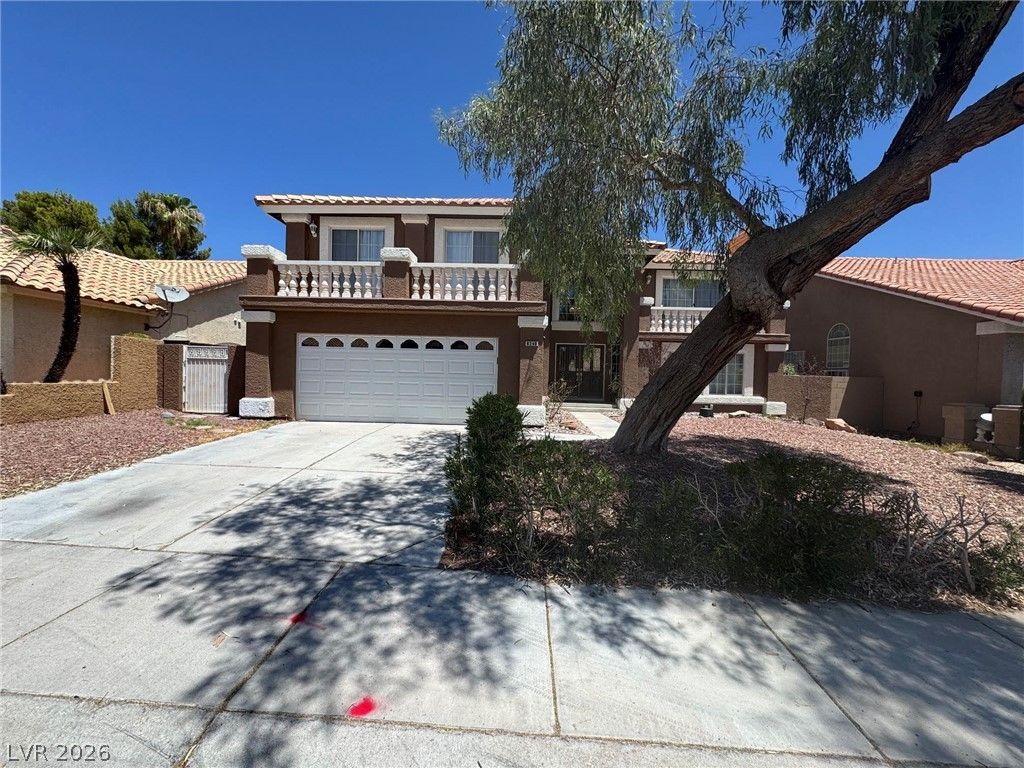
8240 Tivoli Cove DriveActive
$615,0005 bd3 ba3,698 sqft$166/sqft0.22 mi98 days
$570,0004 bd3 ba2,347 sqft$243/sqft0.25 mi49 daysSold 2026-05-26
$685,0004 bd4 ba2,774 sqft$247/sqft0.31 mi23 daysSold 2026-07-02
Nearest comparable sales and listings
12 comparables · median price $642,500 · range $515,000 – $750,000 · median $/sq ft $229 · average $/sq ft $227
| Address | Status | Price | $/Sq Ft | Bd / Ba | Sq Ft | Sold / market time | Distance |
|---|---|---|---|---|---|---|---|
| 2105 Interbay Street | Sold | $700,000 | $298 | 4 / 3 | 2,347 | Sold 2026-07-20 | 0.10 mi |
| 2116 Interbay Street | Sold | $645,000 | $194 | 4 / 3 | 3,330 | Sold 2026-06-03 | 0.11 mi |
| 2117 White Falls Street | Under Contract | $624,990 | $266 | 4 / 3 | 2,347 | 47 days on market | 0.13 mi |
| 8113 Tropic Isle Circle | Sold | $515,000 | $219 | 4 / 3 | 2,347 | Sold 2026-07-23 | 0.16 mi |
| 8216 Tivoli Cove Drive | Sold | $699,900 | $189 | 5 / 4 | 3,698 | Sold 2026-06-15 | 0.18 mi |
| 8217 Ocean Terrace Way | Active | $549,999 | $177 | 4 / 3 | 3,099 | 166 days on market | 0.21 mi |
| 7908 Waterfalls Avenue | Active | $664,900 | $283 | 4 / 3 | 2,347 | 0 days on market | 0.22 mi |
| 8240 Tivoli Cove Drive | Active | $615,000 | $166 | 5 / 3 | 3,698 | 98 days on market | 0.22 mi |
| 7901 Waterfalls Avenue | Sold | $570,000 | $243 | 4 / 3 | 2,347 | Sold 2026-05-26 | 0.25 mi |
| 7813 Waterfalls Avenue | Sold | $685,000 | $247 | 4 / 4 | 2,774 | Sold 2026-07-02 | 0.31 mi |
| 7956 Marbella Circle | Active | $750,000 | $238 | 4 / 3 | 3,153 | 4 days on market | 0.35 mi |
| 2004 Lady Lake Street | Active | $640,000 | $197 | 4 / 5 | 3,250 | 18 days on market | 0.36 mi |


