
Comparable Sales Near 7500 Sea Spray Avenue, Las Vegas, NV 89128
1st Realty · Comparable sales report · 1st.estate · October 20, 2026
Browse our Las Vegas area guides →
7500 Sea Spray Avenue, Las Vegas, NV 89128
Status: Sold
$455,000 Sold Price
$297
$ / Sq Ft
1,531
Living Area
4,792 sqft
Lot Size
3
Beds
3
Baths
1993
Year Built
Search Parameters
Property Type
Status
Radius
Sold Within
Beds
Baths
Living Area (Sq Ft)
Lot Size (Sq Ft)
This comp search reflects your current search parameters — adjust the filters above as needed for a more accurate estimate.
Estimated Value
—
Average $/Sqft
—
Check one or more comps below to calculate an estimate.
Nearest 10 of 43 comparable sales and listings within 1 mile of this home. Use the filters above and press Search to refine.
$405,0003 bd3 ba1,481 sqft$273/sqft0.05 mi7 daysSold 2026-04-30
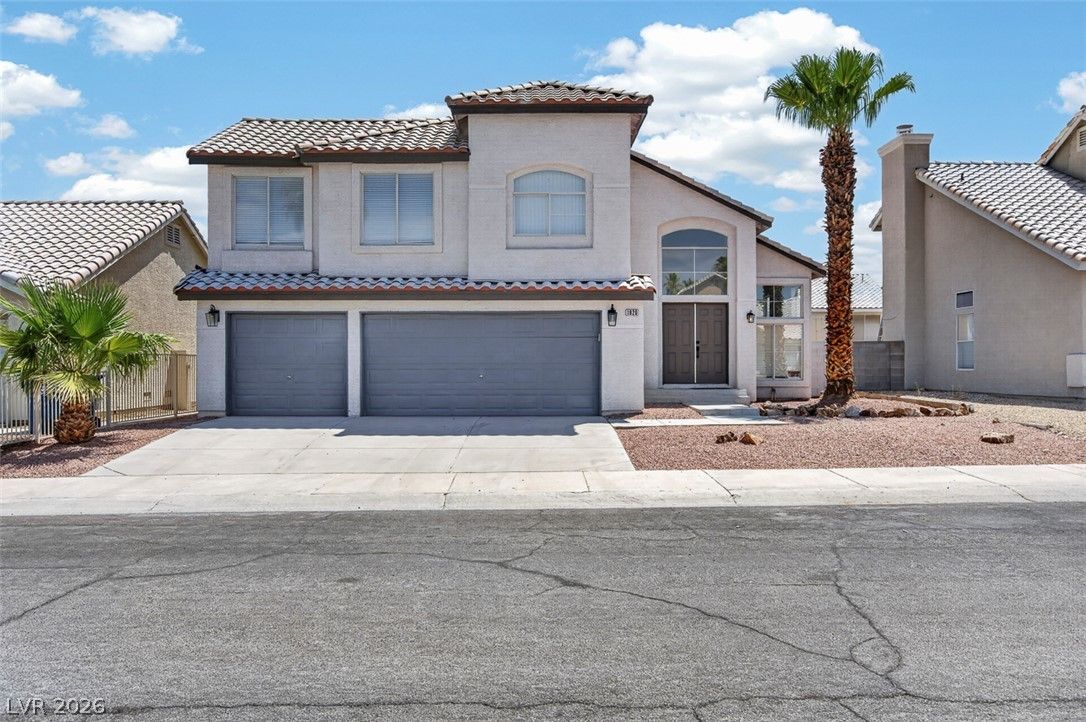
$465,0004 bd3 ba1,807 sqft$257/sqft0.09 mi6 daysSold 2026-08-27
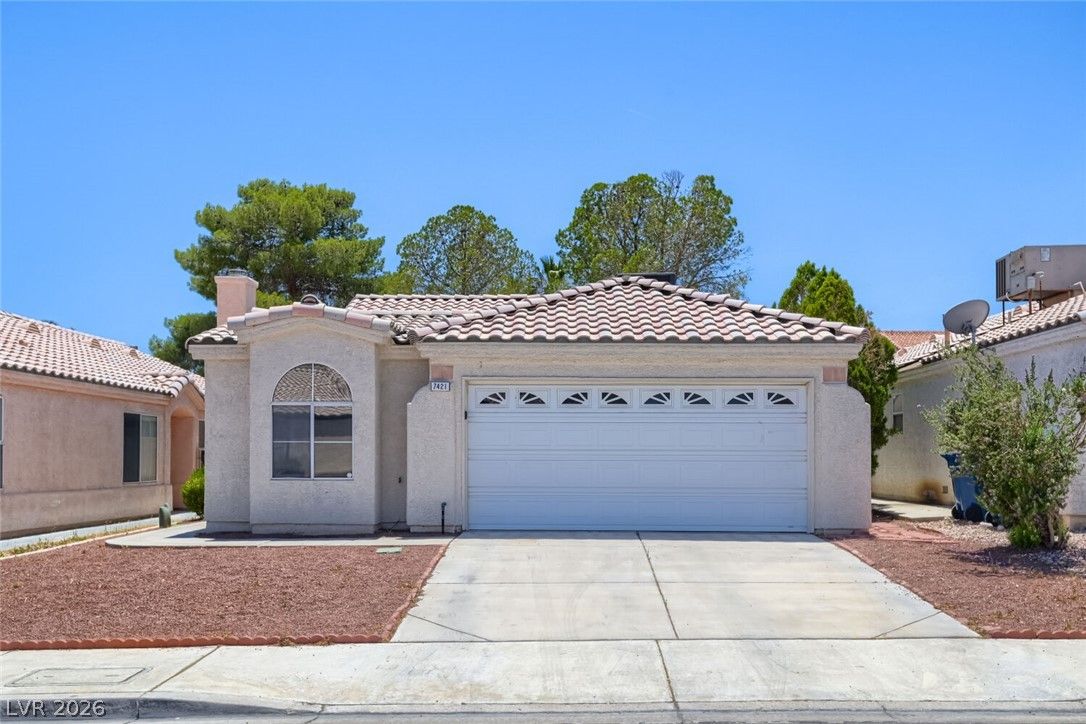
7421 Summer Sun DriveActive
$369,9002 bd2 ba1,326 sqft$279/sqft0.14 mi99 days
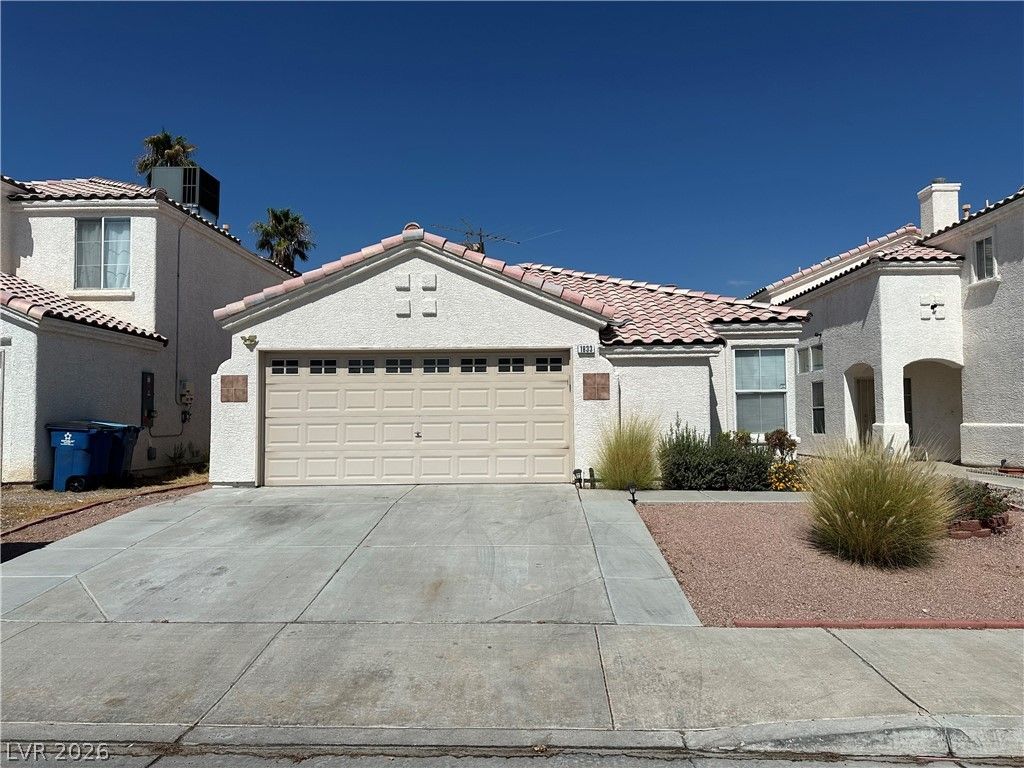
$395,0003 bd2 ba1,322 sqft$299/sqft0.17 mi34 daysSold 2026-09-25
1624 Palmae WaySold
$390,0003 bd2 ba1,373 sqft$284/sqft0.19 mi2 daysSold 2026-06-12
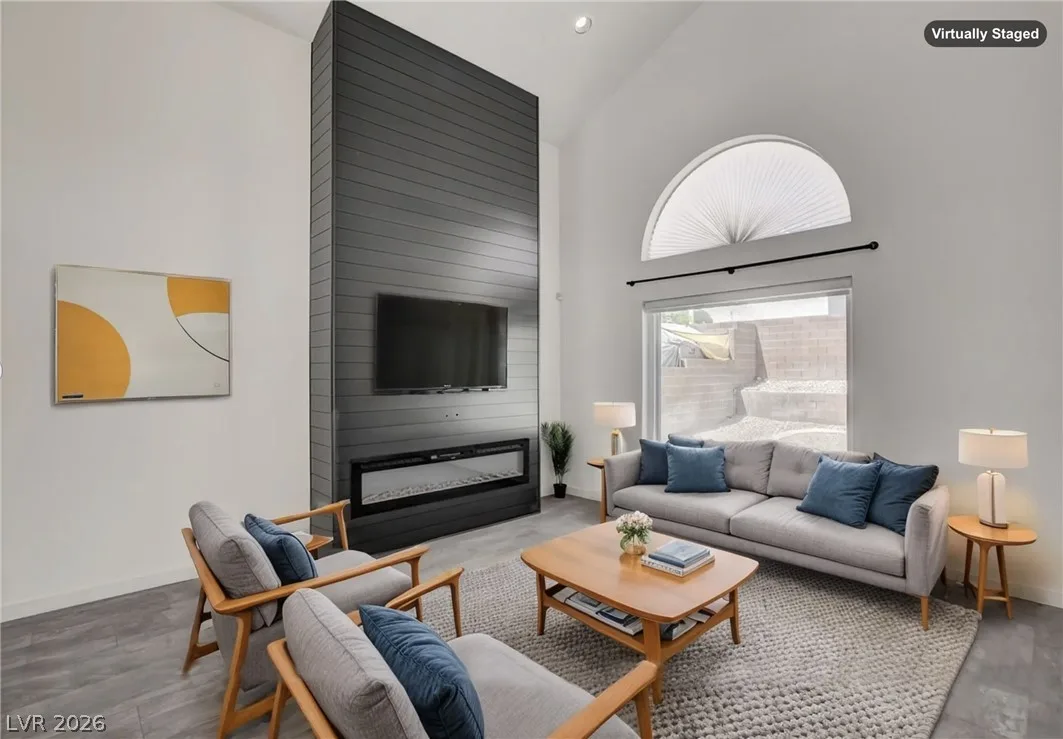
1837 Sierra Valley WayUnder Contract
$395,0003 bd3 ba1,481 sqft$267/sqft0.21 mi19 days
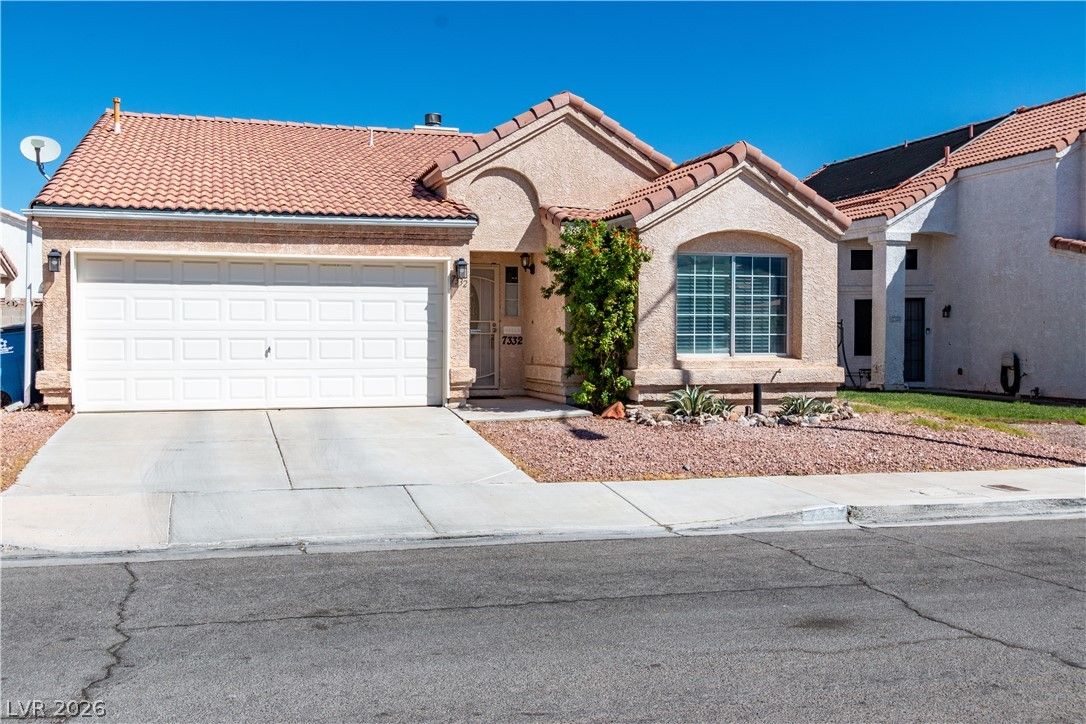
7332 Queen Palm DriveActive
$400,0002 bd2 ba1,373 sqft$291/sqft0.22 mi0 days

$380,0003 bd2 ba1,273 sqft$299/sqft0.24 mi84 days
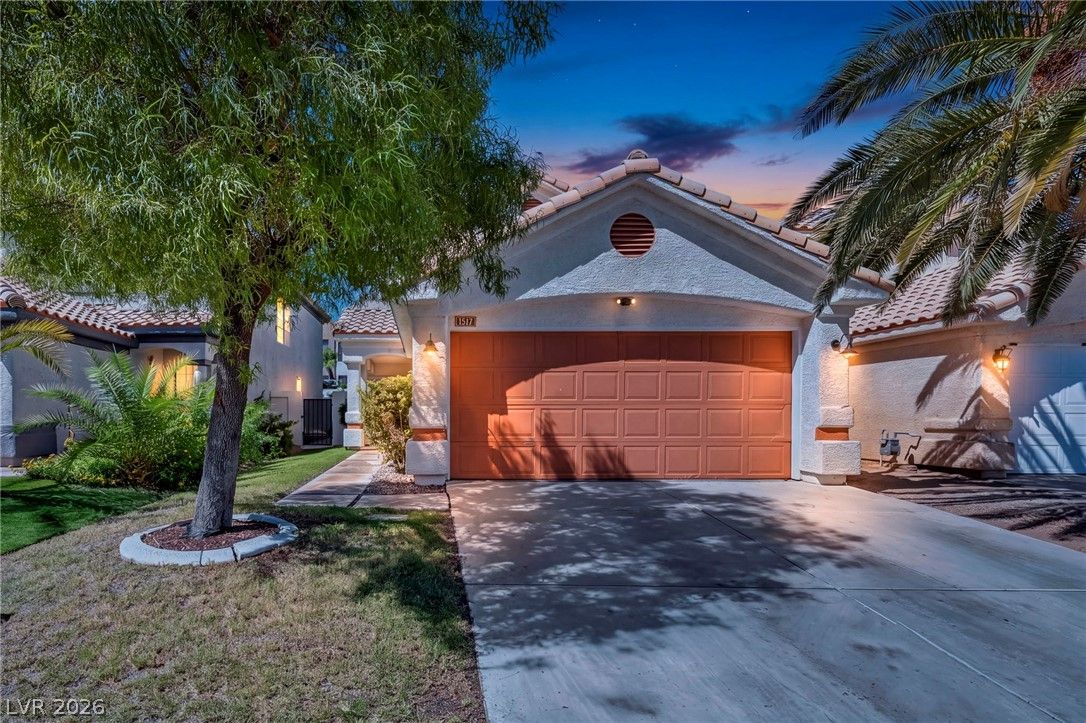
1517 Bellglen DriveActive
$389,0003 bd3 ba1,561 sqft$249/sqft0.26 mi27 days
$405,0003 bd3 ba1,481 sqft$273/sqft0.26 mi34 daysSold 2026-06-08
Nearest comparable sales and listings
12 comparables · median price $395,000 · range $369,900 – $465,000 · median $/sq ft $276 · average $/sq ft $282
| Address | Status | Price | $/Sq Ft | Bd / Ba | Sq Ft | Sold / market time | Distance |
|---|---|---|---|---|---|---|---|
| 1721 Navajo Lake Way | Sold | $405,000 | $273 | 3 / 3 | 1,481 | Sold 2026-04-30 | 0.05 mi |
| 1820 Battle Born Drive | Sold | $465,000 | $257 | 4 / 3 | 1,807 | Sold 2026-08-27 | 0.09 mi |
| 7421 Summer Sun Drive | Active | $369,900 | $279 | 2 / 2 | 1,326 | 99 days on market | 0.14 mi |
| 1833 Cedar Bluffs Way | Sold | $395,000 | $299 | 3 / 2 | 1,322 | Sold 2026-09-25 | 0.17 mi |
| 1624 Palmae Way | Sold | $390,000 | $284 | 3 / 2 | 1,373 | Sold 2026-06-12 | 0.19 mi |
| 1837 Sierra Valley Way | Under Contract | $395,000 | $267 | 3 / 3 | 1,481 | 19 days on market | 0.21 mi |
| 7332 Queen Palm Drive | Active | $400,000 | $291 | 2 / 2 | 1,373 | 0 days on market | 0.22 mi |
| 7432 Saybrook Point Drive | Active | $380,000 | $299 | 3 / 2 | 1,273 | 84 days on market | 0.24 mi |
| 1517 Bellglen Drive | Active | $389,000 | $249 | 3 / 3 | 1,561 | 27 days on market | 0.26 mi |
| 1845 Villa Vista Way | Sold | $405,000 | $273 | 3 / 3 | 1,481 | Sold 2026-06-08 | 0.26 mi |
| 1721 Pomerado Drive | Sold | $395,000 | $340 | 3 / 2 | 1,162 | Sold 2026-06-15 | 0.26 mi |
| 1432 Lucia Drive | Sold | $399,900 | $268 | 3 / 2 | 1,493 | Sold 2026-09-18 | 0.30 mi |


