
Comparable Sales Near 5917 Victory Point Street, North Las Vegas, NV 89081
1st Realty · Comparable sales report · 1st.estate · October 20, 2026
Read the North Las Vegas area guide →
5917 Victory Point Street, North Las Vegas, NV 89081
Status: Sold
$1,995 Sold Price
$1
$ / Sq Ft
2,015
Living Area
4,792 sqft
Lot Size
4
Beds
3
Baths
2004
Year Built
Search Parameters
Property Type
Status
Radius
Sold Within
Beds
Baths
Living Area (Sq Ft)
Lot Size (Sq Ft)
This comp search reflects your current search parameters — adjust the filters above as needed for a more accurate estimate.
Estimated Value
—
Average $/Sqft
—
Check one or more comps below to calculate an estimate.
Nearest 10 of 79 comparable sales and listings within 1 mile of this home. Use the filters above and press Search to refine.
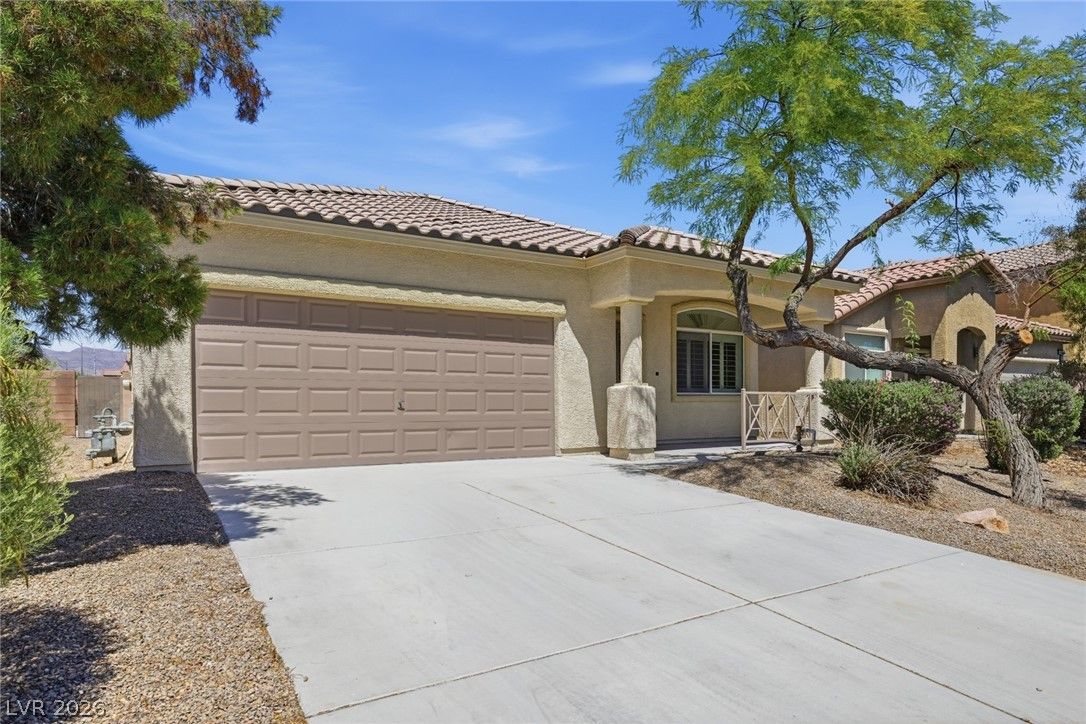
$440,0003 bd2 ba1,617 sqft$272/sqft0.15 mi59 daysSold 2026-07-24
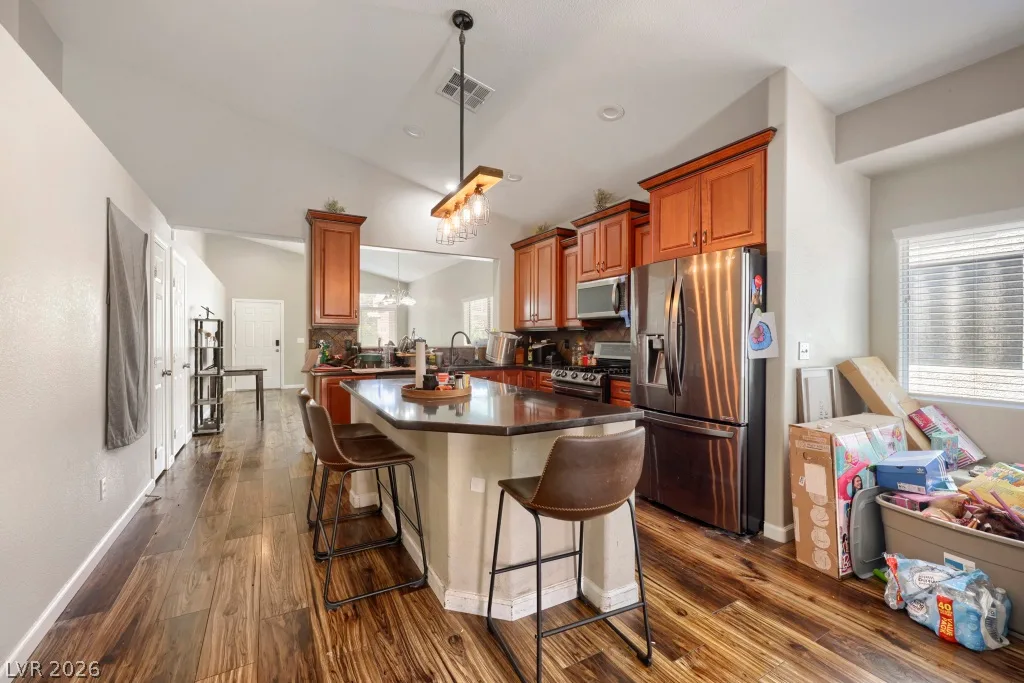
$386,0003 bd2 ba1,617 sqft$239/sqft0.16 mi23 days
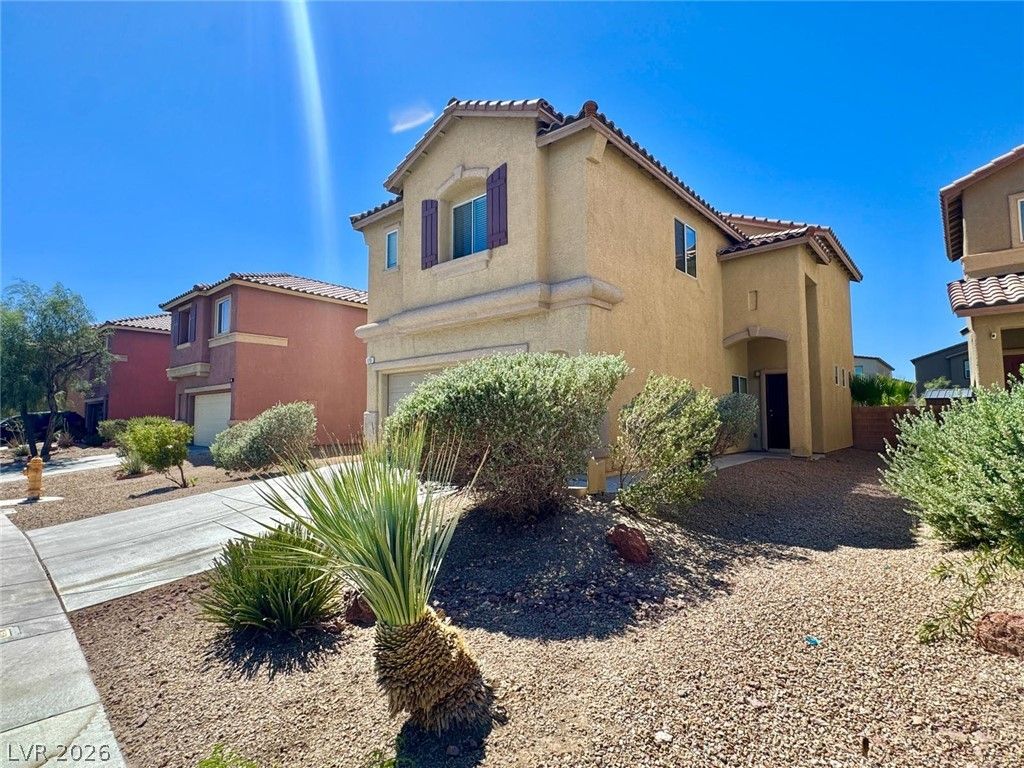
$374,0003 bd3 ba1,645 sqft$227/sqft0.16 mi8 daysSold 2026-08-14

6020 Gum Springs StreetActive
$422,0003 bd3 ba2,344 sqft$180/sqft0.18 mi33 days
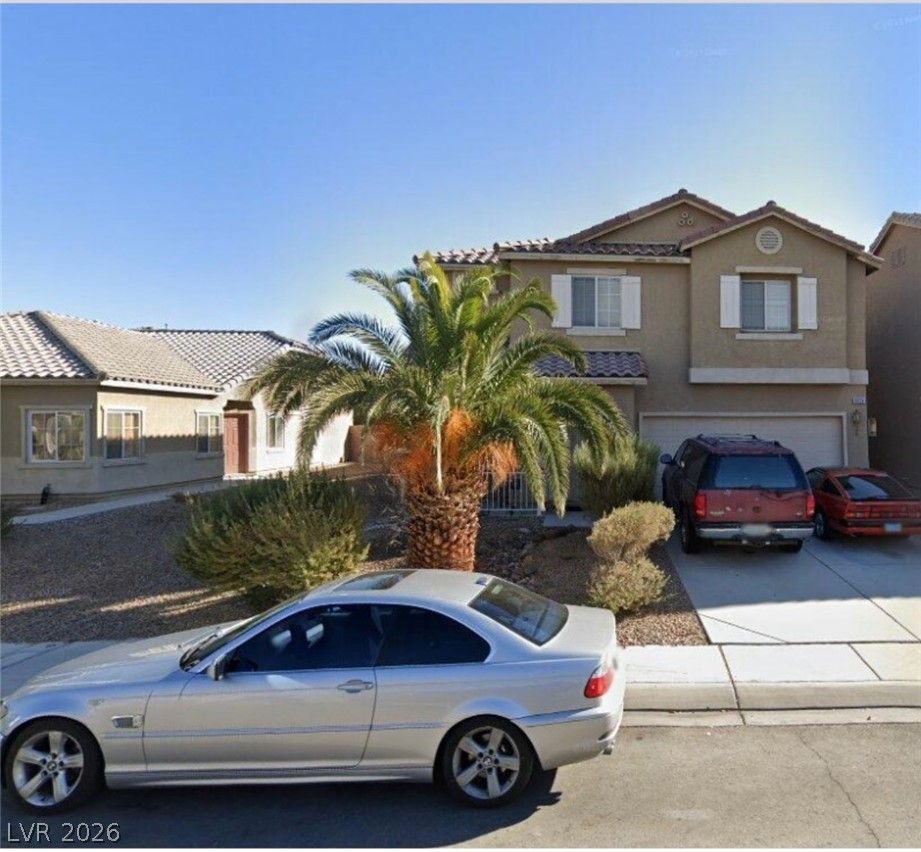
6028 Gum Springs StreetActive
$429,9994 bd3 ba2,007 sqft$214/sqft0.20 mi62 days
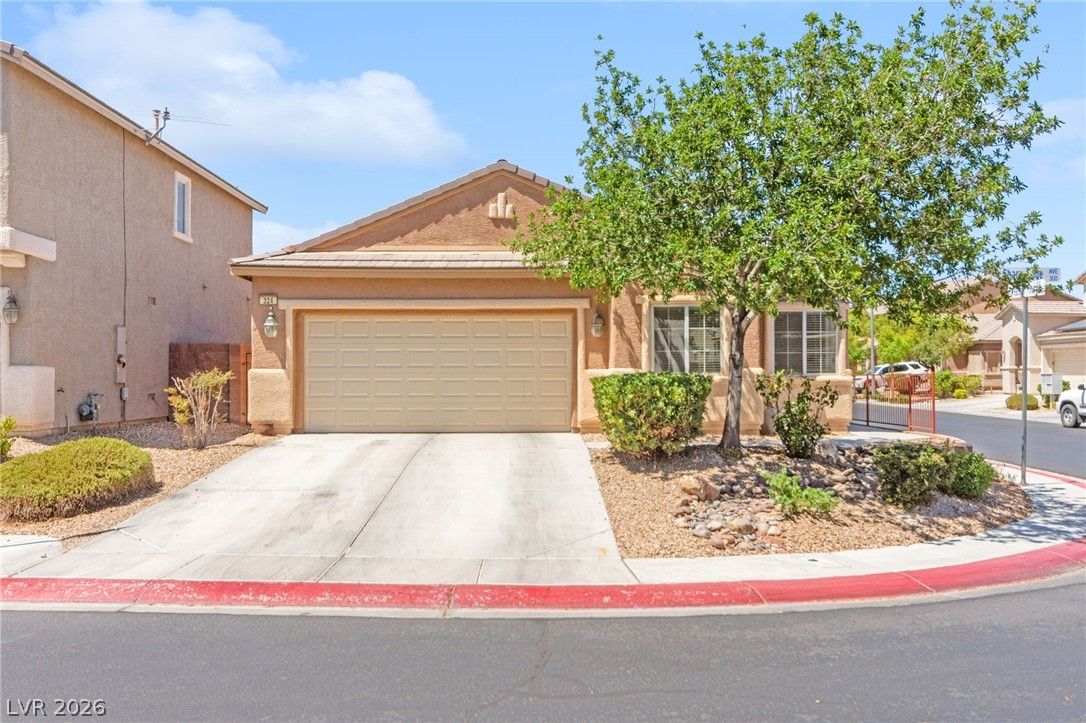
$379,9004 bd2 ba1,672 sqft$227/sqft0.20 mi2 daysSold 2026-10-06
$420,0004 bd3 ba2,386 sqft$176/sqft0.22 mi146 daysSold 2026-05-22
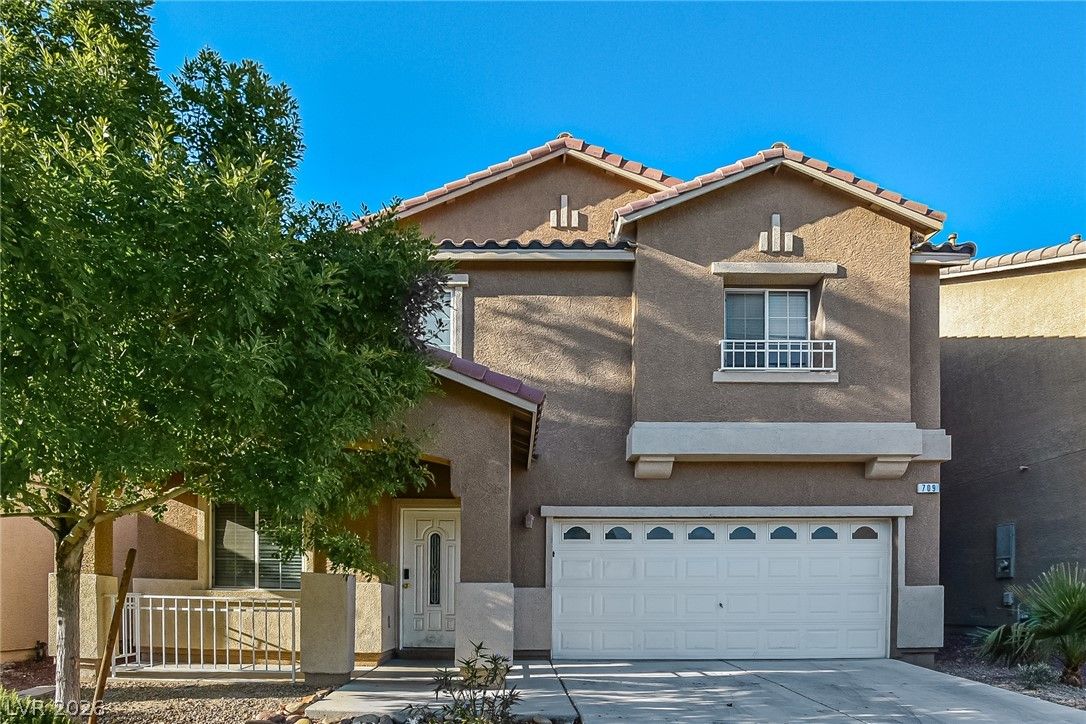
$413,0003 bd3 ba2,344 sqft$176/sqft0.22 mi27 daysSold 2026-09-11
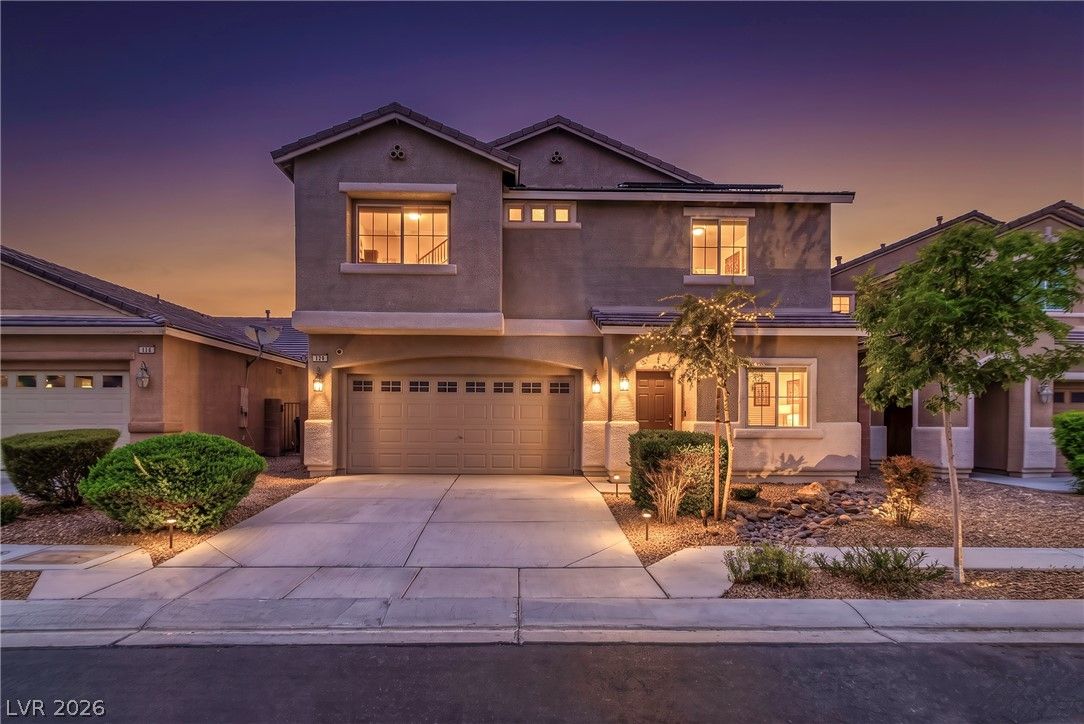
$440,0004 bd3 ba2,386 sqft$184/sqft0.27 mi7 daysSold 2026-09-17
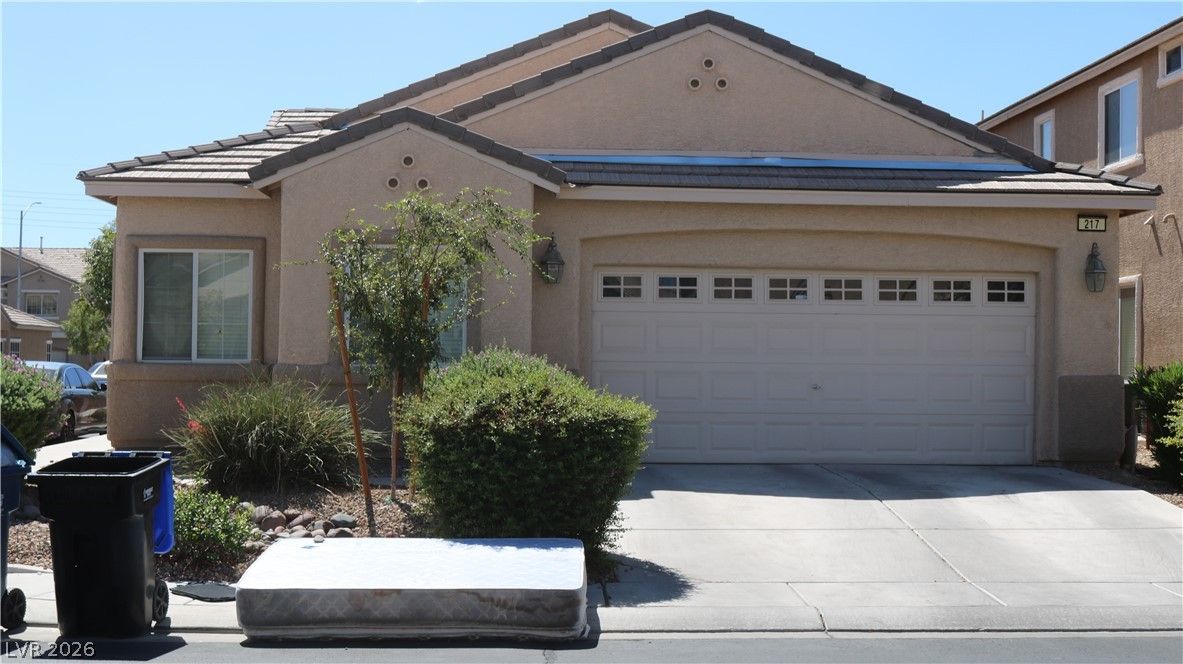
217 Iron Summit AvenueActive
$410,0004 bd2 ba1,672 sqft$245/sqft0.30 mi2 days
Nearest comparable sales and listings
12 comparables · median price $411,500 · range $374,000 – $440,000 · median $/sq ft $227 · average $/sq ft $219
| Address | Status | Price | $/Sq Ft | Bd / Ba | Sq Ft | Sold / market time | Distance |
|---|---|---|---|---|---|---|---|
| 728 Brown Breeches Avenue | Sold | $440,000 | $272 | 3 / 2 | 1,617 | Sold 2026-07-24 | 0.15 mi |
| 804 Brown Breeches Avenue | Active | $386,000 | $239 | 3 / 2 | 1,617 | 23 days on market | 0.16 mi |
| 725 Brown Breeches Avenue | Sold | $374,000 | $227 | 3 / 3 | 1,645 | Sold 2026-08-14 | 0.16 mi |
| 6020 Gum Springs Street | Active | $422,000 | $180 | 3 / 3 | 2,344 | 33 days on market | 0.18 mi |
| 6028 Gum Springs Street | Active | $429,999 | $214 | 4 / 3 | 2,007 | 62 days on market | 0.20 mi |
| 324 Sharp Edge Avenue | Sold | $379,900 | $227 | 4 / 2 | 1,672 | Sold 2026-10-06 | 0.20 mi |
| 6024 Peacock Pine Street | Sold | $420,000 | $176 | 4 / 3 | 2,386 | Sold 2026-05-22 | 0.22 mi |
| 709 Horse Stable Avenue | Sold | $413,000 | $176 | 3 / 3 | 2,344 | Sold 2026-09-11 | 0.22 mi |
| 120 Sharp Edge Avenue | Sold | $440,000 | $184 | 4 / 3 | 2,386 | Sold 2026-09-17 | 0.27 mi |
| 217 Iron Summit Avenue | Active | $410,000 | $245 | 4 / 2 | 1,672 | 2 days on market | 0.30 mi |
| 732 Cowboy Cross Avenue | Sold | $400,000 | $242 | 4 / 2 | 1,656 | Sold 2026-06-02 | 0.31 mi |
| 5722 Old Pine Street | Sold | $409,000 | $248 | 3 / 2 | 1,649 | Sold 2026-09-22 | 0.32 mi |


