
Comparable Sales Near 1150 North Buffalo Drive 2025, Las Vegas, NV 89128
1st Realty · Comparable sales report · 1st.estate · October 20, 2026
Browse our Las Vegas area guides →
1150 North Buffalo Drive 2025, Las Vegas, NV 89128
Status: Sold
$240,000 Sold Price
$259
$ / Sq Ft
928
Living Area
8,400 sqft
Lot Size
2
Beds
2
Baths
1996
Year Built
Search Parameters
Property Type
Status
Radius
Sold Within
Beds
Baths
Living Area (Sq Ft)
Lot Size (Sq Ft)
This comp search reflects your current search parameters — adjust the filters above as needed for a more accurate estimate.
Estimated Value
—
Average $/Sqft
—
Check one or more comps below to calculate an estimate.
Nearest 10 of 16 comparable sales and listings within 1 mile of this home. Use the filters above and press Search to refine.
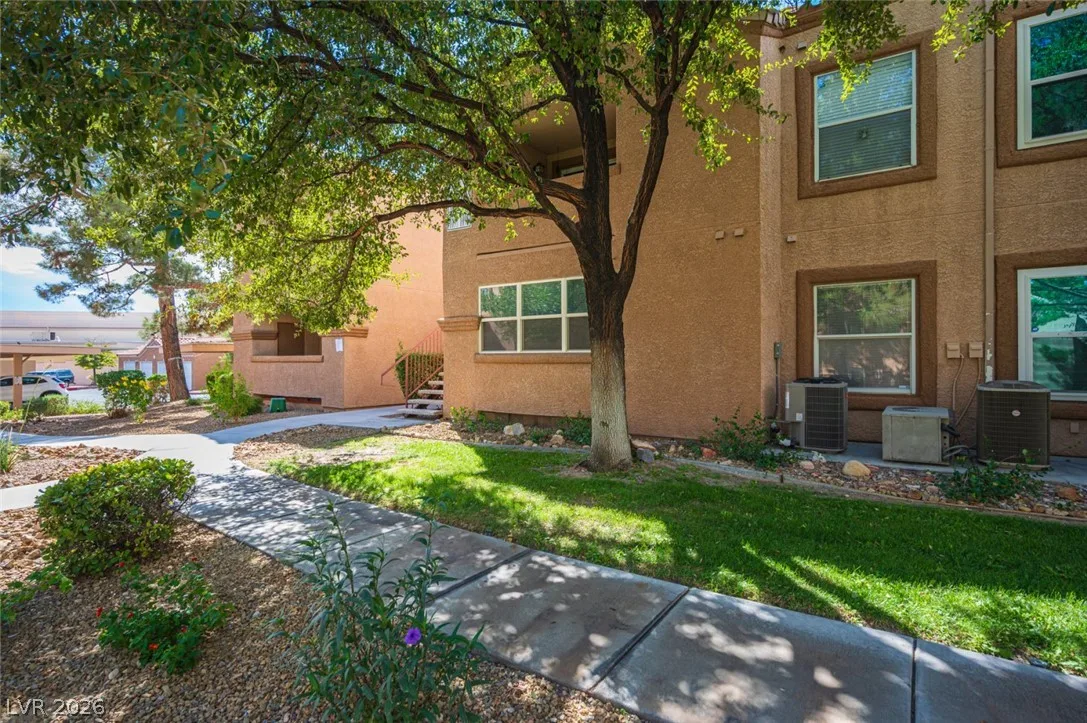
$185,0001 bd1 ba825 sqft$224/sqft0.10 mi19 days
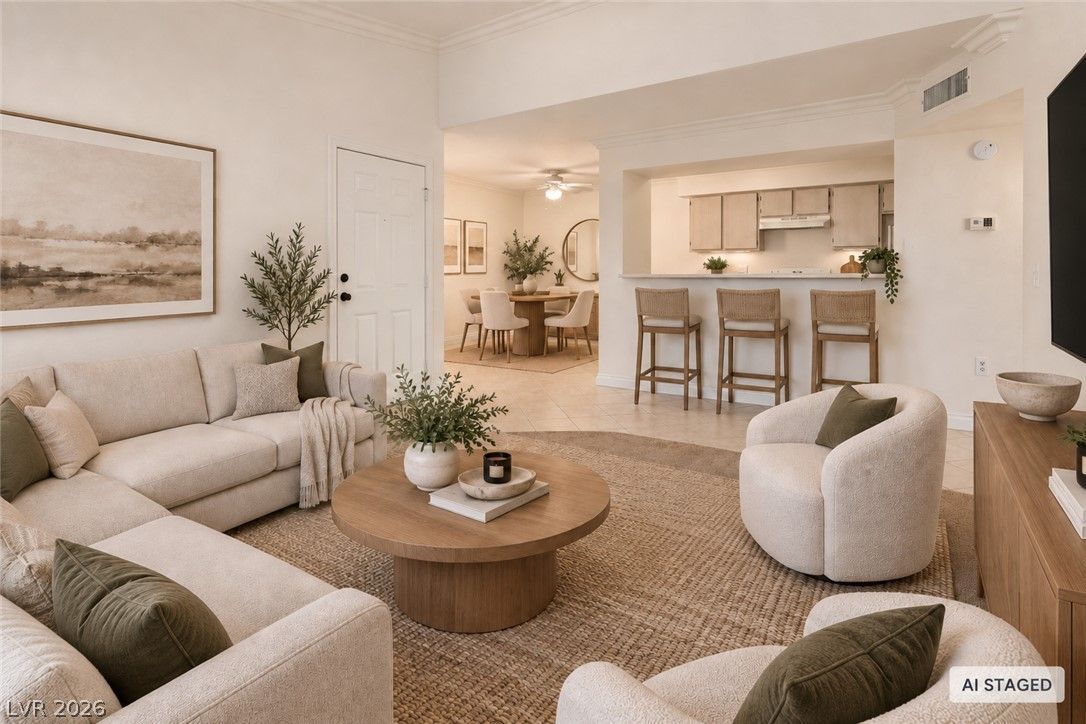
$174,9001 bd1 ba825 sqft$212/sqft0.10 mi27 days

$235,0002 bd2 ba1,062 sqft$221/sqft0.10 mi3 days

$255,0002 bd2 ba1,062 sqft$240/sqft0.13 mi48 days
$250,0002 bd2 ba1,062 sqft$235/sqft0.48 mi53 daysSold 2026-07-17

$228,0002 bd2 ba1,062 sqft$215/sqft0.50 mi26 days
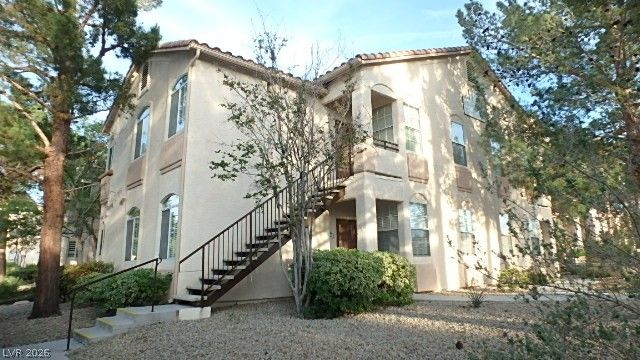
$228,0002 bd2 ba1,062 sqft$215/sqft0.54 mi79 days
$163,5001 bd1 ba711 sqft$230/sqft0.67 mi8 daysSold 2026-06-18

$168,0002 bd2 ba1,002 sqft$168/sqft0.67 mi3 daysSold 2026-09-18
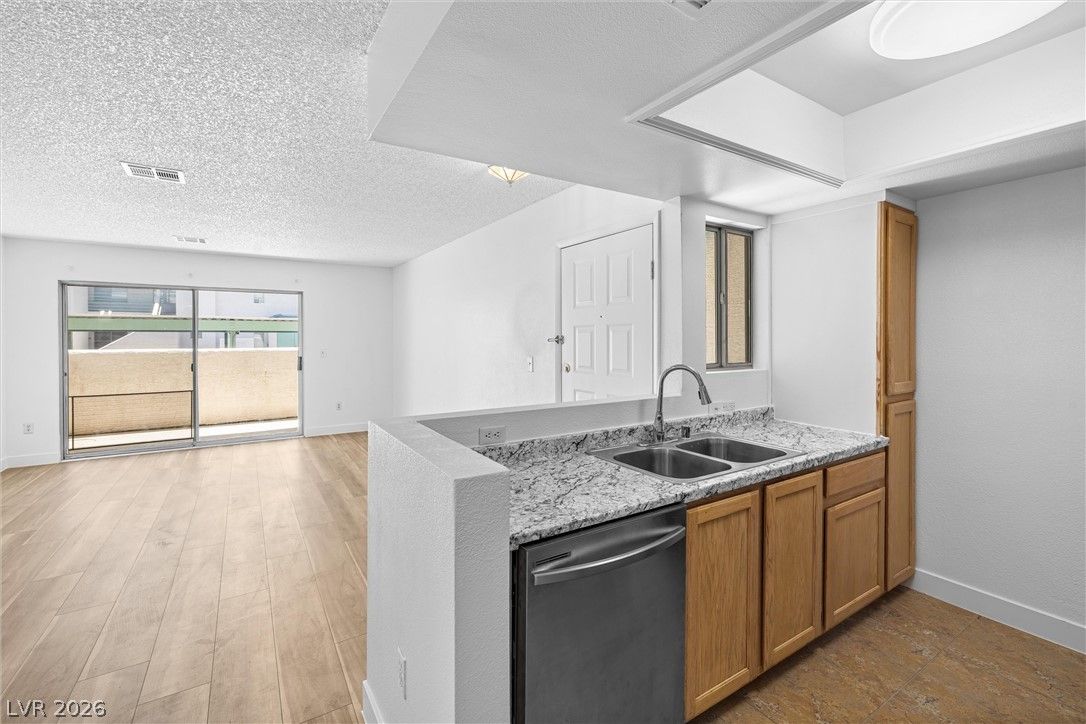
$162,5001 bd1 ba711 sqft$229/sqft0.69 mi33 daysSold 2026-08-13
Nearest comparable sales and listings
12 comparables · median price $192,450 · range $155,000 – $255,000 · median $/sq ft $223 · average $/sq ft $224
| Address | Status | Price | $/Sq Ft | Bd / Ba | Sq Ft | Sold / market time | Distance |
|---|---|---|---|---|---|---|---|
| 1150 North Buffalo Drive 1098 | Active | $185,000 | $224 | 1 / 1 | 825 | 19 days on market | 0.10 mi |
| 1150 North Buffalo Drive 2094 | Active | $174,900 | $212 | 1 / 1 | 825 | 27 days on market | 0.10 mi |
| 1150 North Buffalo Drive 2062 | Active | $235,000 | $221 | 2 / 2 | 1,062 | 3 days on market | 0.10 mi |
| 1150 North Buffalo Drive 1075 | Active | $255,000 | $240 | 2 / 2 | 1,062 | 48 days on market | 0.13 mi |
| 1830 North Buffalo Drive 1007 | Sold | $250,000 | $235 | 2 / 2 | 1,062 | Sold 2026-07-17 | 0.48 mi |
| 1830 North Buffalo Drive 2033 | Active | $228,000 | $215 | 2 / 2 | 1,062 | 26 days on market | 0.50 mi |
| 1830 North Buffalo Drive 1042 | Active | $228,000 | $215 | 2 / 2 | 1,062 | 79 days on market | 0.54 mi |
| 7100 Pirates Cove Road 2086 | Sold | $163,500 | $230 | 1 / 1 | 711 | Sold 2026-06-18 | 0.67 mi |
| 7100 Pirates Cove Road 2080 | Sold | $168,000 | $168 | 2 / 2 | 1,002 | Sold 2026-09-18 | 0.67 mi |
| 7100 Pirates Cove Road 1106 | Sold | $162,500 | $229 | 1 / 1 | 711 | Sold 2026-08-13 | 0.69 mi |
| 7100 Pirates Cove Road 2039 | Sold | $155,000 | $218 | 1 / 1 | 711 | Sold 2026-04-30 | 0.71 mi |
| 1908 Rio Canyon Court 206 | Active | $199,900 | $283 | 1 / 1 | 707 | 3 days on market | 0.82 mi |


