
Comparable Sales Near 9309 Roping Cowboy Avenue, Las Vegas, NV 89178
1st Realty · Comparable sales report · 1st.estate · October 20, 2026
Read the Enterprise neighborhood guide →
9309 Roping Cowboy Avenue, Las Vegas, NV 89178
Status: Sold
$2,100 Sold Price
$1
$ / Sq Ft
1,977
Living Area
2,614 sqft
Lot Size
4
Beds
4
Baths
2006
Year Built
Search Parameters
Property Type
Status
Radius
Sold Within
Beds
Baths
Living Area (Sq Ft)
Lot Size (Sq Ft)
This comp search reflects your current search parameters — adjust the filters above as needed for a more accurate estimate.
Estimated Value
—
Average $/Sqft
—
Check one or more comps below to calculate an estimate.
Nearest 10 of 33 comparable sales and listings within 1 mile of this home. Use the filters above and press Search to refine.
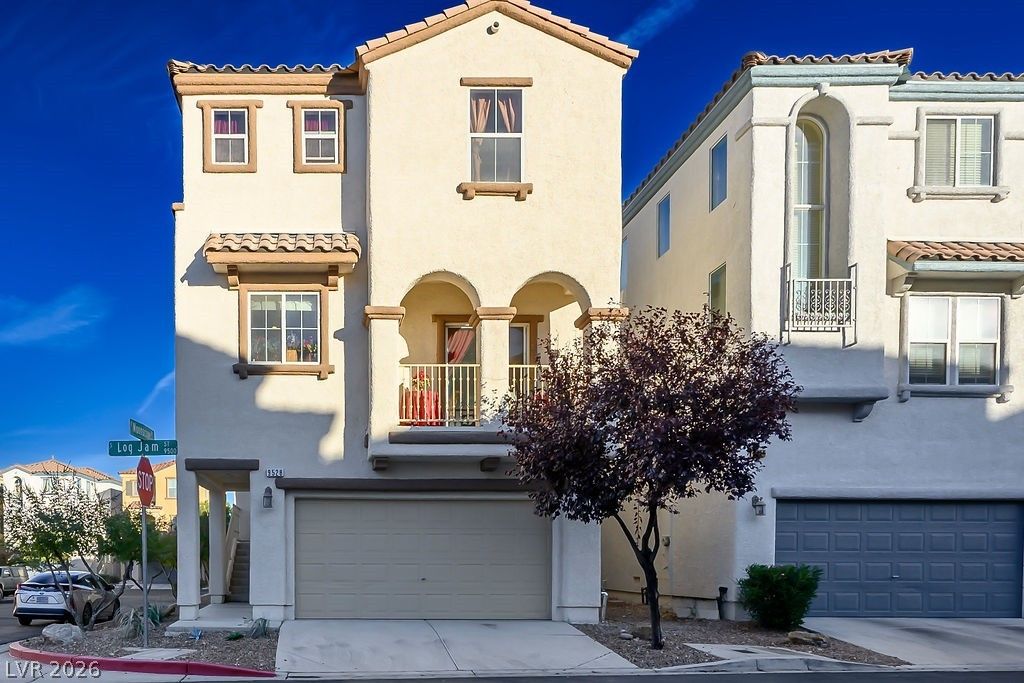
$412,5003 bd4 ba1,977 sqft$209/sqft0.08 mi44 daysSold 2026-08-14
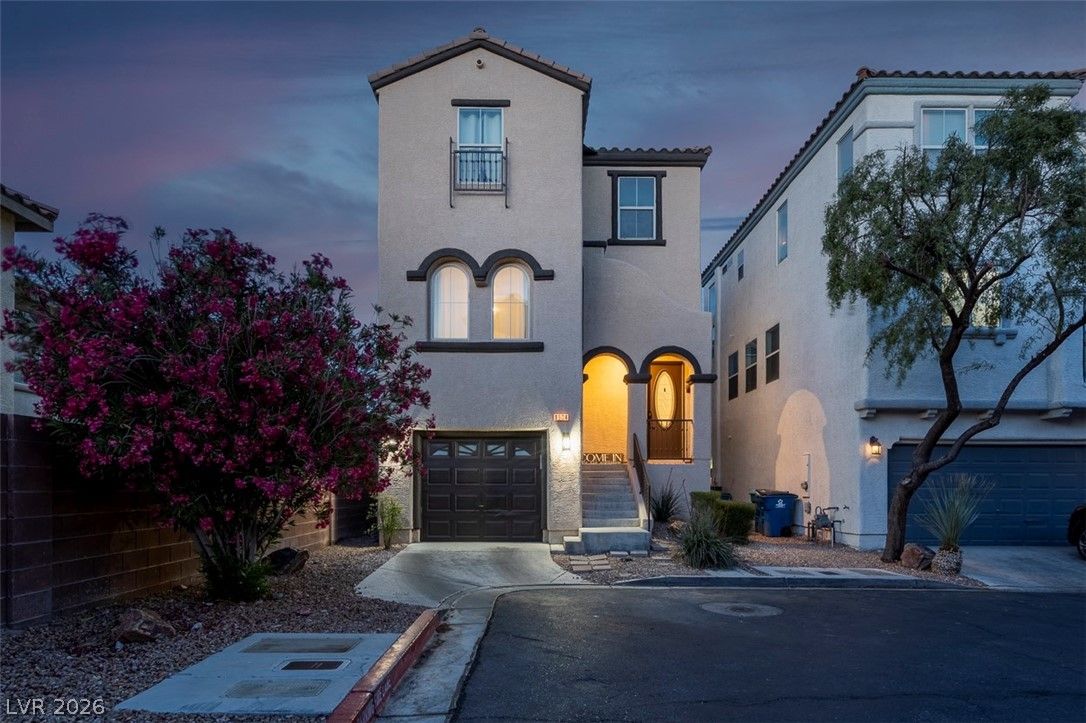
$405,0003 bd3 ba1,554 sqft$261/sqft0.11 mi57 daysSold 2026-08-04
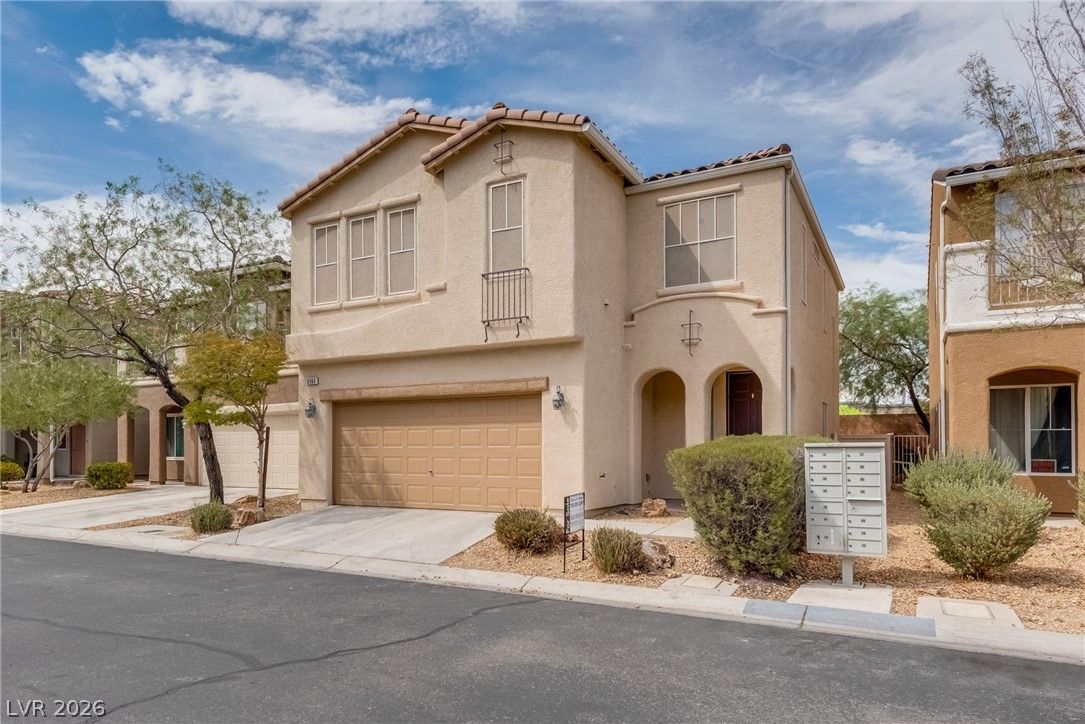
9360 Netherfield AvenueActive
$399,9953 bd3 ba1,846 sqft$217/sqft0.16 mi52 days
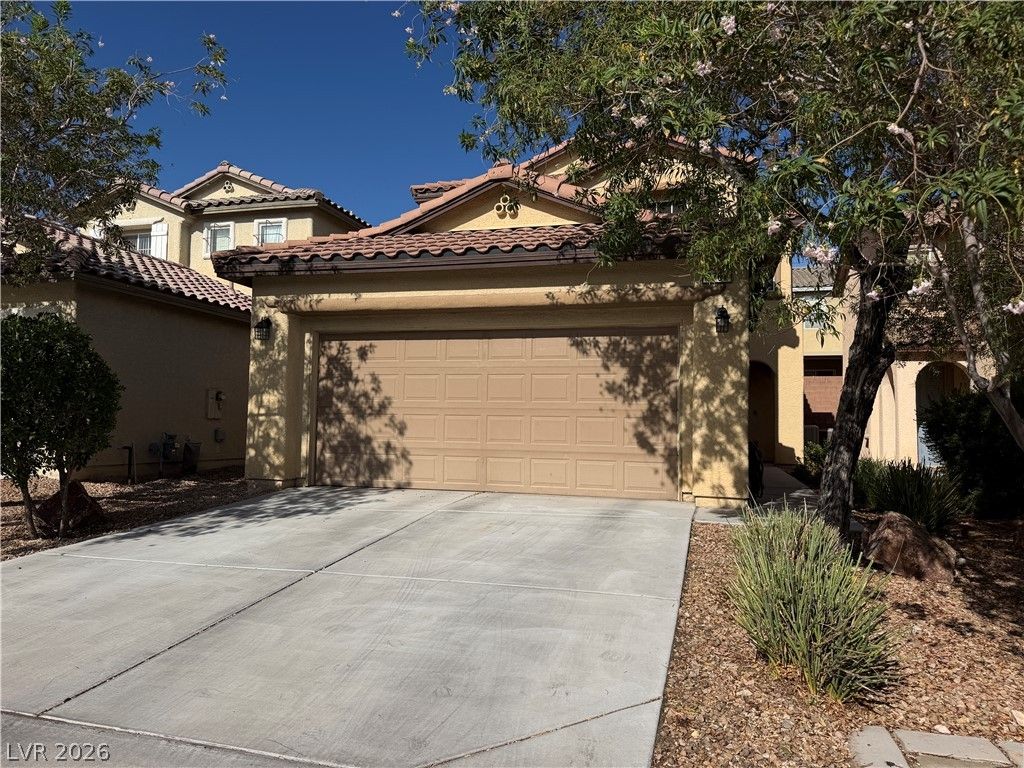
9761 Plane Tree CourtActive
$460,0003 bd4 ba1,797 sqft$256/sqft0.21 mi19 days
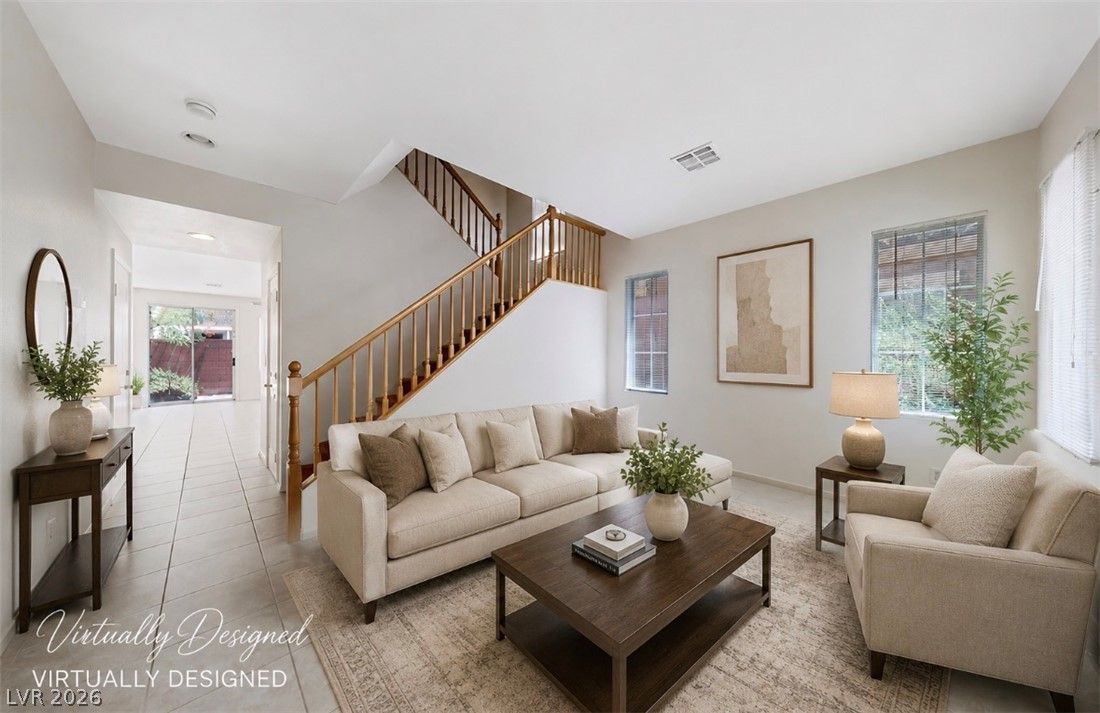
$399,9994 bd3 ba2,168 sqft$185/sqft0.28 mi64 days
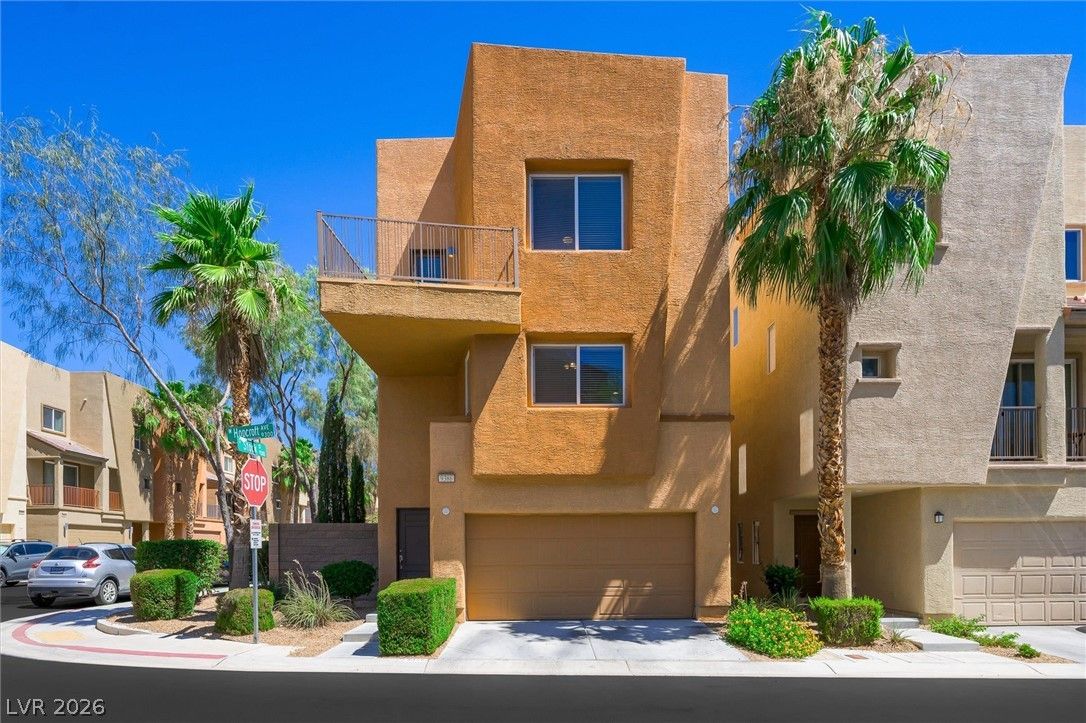
$410,0003 bd4 ba1,813 sqft$226/sqft0.30 mi15 daysSold 2026-08-03
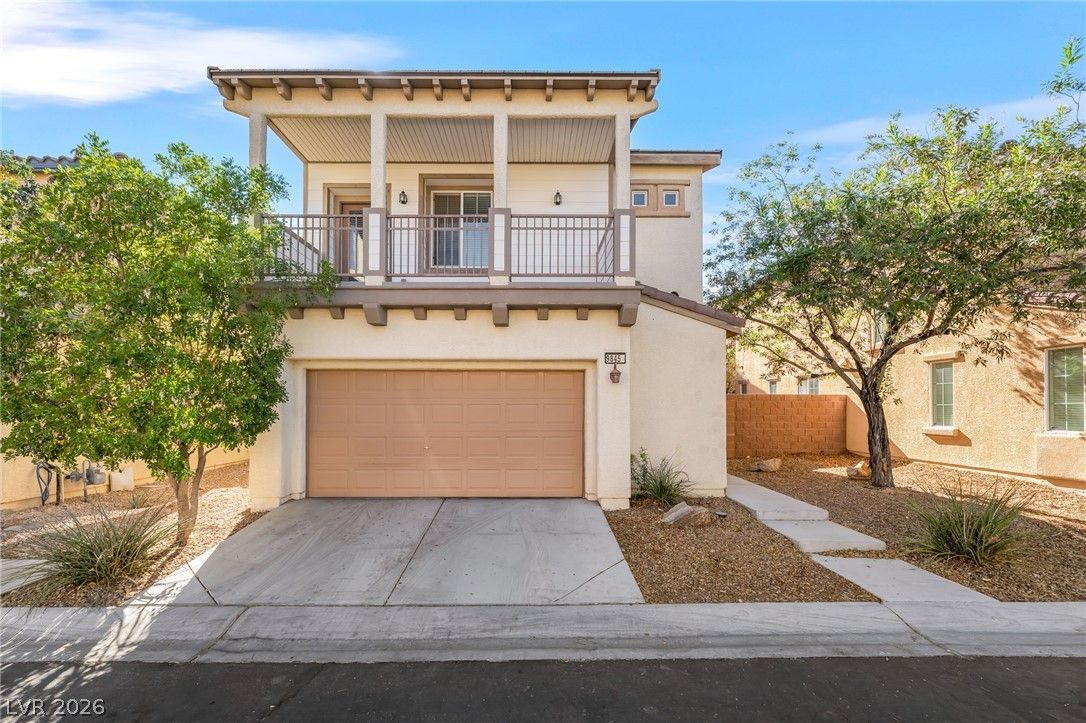
$375,0003 bd3 ba1,573 sqft$238/sqft0.30 mi14 daysSold 2026-10-16
$439,0003 bd4 ba1,864 sqft$236/sqft0.34 mi14 daysSold 2026-06-03
$460,0003 bd3 ba2,123 sqft$217/sqft0.35 mi6 daysSold 2026-05-08
$403,0004 bd3 ba1,784 sqft$226/sqft0.38 mi3 daysSold 2026-05-08
Nearest comparable sales and listings
12 comparables · median price $411,250 · range $375,000 – $460,000 · median $/sq ft $221 · average $/sq ft $224
| Address | Status | Price | $/Sq Ft | Bd / Ba | Sq Ft | Sold / market time | Distance |
|---|---|---|---|---|---|---|---|
| 9528 Log Jam Street | Sold | $412,500 | $209 | 3 / 4 | 1,977 | Sold 2026-08-14 | 0.08 mi |
| 9504 Log Jam Street | Sold | $405,000 | $261 | 3 / 3 | 1,554 | Sold 2026-08-04 | 0.11 mi |
| 9360 Netherfield Avenue | Active | $399,995 | $217 | 3 / 3 | 1,846 | 52 days on market | 0.16 mi |
| 9761 Plane Tree Court | Active | $460,000 | $256 | 3 / 4 | 1,797 | 19 days on market | 0.21 mi |
| 9834 Mandrake Falls Street | Active | $399,999 | $185 | 4 / 3 | 2,168 | 64 days on market | 0.28 mi |
| 9386 Hopcroft Avenue | Sold | $410,000 | $226 | 3 / 4 | 1,813 | Sold 2026-08-03 | 0.30 mi |
| 9845 Iris Valley Street | Sold | $375,000 | $238 | 3 / 3 | 1,573 | Sold 2026-10-16 | 0.30 mi |
| 9865 Lime Tree Street | Sold | $439,000 | $236 | 3 / 4 | 1,864 | Sold 2026-06-03 | 0.34 mi |
| 9319 Poseidon Valley Avenue | Sold | $460,000 | $217 | 3 / 3 | 2,123 | Sold 2026-05-08 | 0.35 mi |
| 9020 Fathers Pride Avenue | Sold | $403,000 | $226 | 4 / 3 | 1,784 | Sold 2026-05-08 | 0.38 mi |
| 9210 VALLEY RANCH Avenue | Active | $417,000 | $216 | 3 / 3 | 1,933 | 3 days on market | 0.42 mi |
| 9941 El Corriente Street | Sold | $425,000 | $208 | 3 / 3 | 2,041 | Sold 2026-06-25 | 0.44 mi |


