
Comparable Sales Near 2113 Waterbury Lane, Las Vegas, NV 89134
1st Realty · Comparable sales report · 1st.estate · October 20, 2026
Browse our Las Vegas area guides →
2113 Waterbury Lane, Las Vegas, NV 89134
Status: Sold
$840,000 Sold Price
$278
$ / Sq Ft
3,027
Living Area
6,970 sqft
Lot Size
4
Beds
3
Baths
1994
Year Built
Search Parameters
Property Type
Status
Radius
Sold Within
Beds
Baths
Living Area (Sq Ft)
Lot Size (Sq Ft)
This comp search reflects your current search parameters — adjust the filters above as needed for a more accurate estimate.
Estimated Value
—
Average $/Sqft
—
Check one or more comps below to calculate an estimate.
Nearest 10 of 43 comparable sales and listings within 1 mile of this home. Use the filters above and press Search to refine.
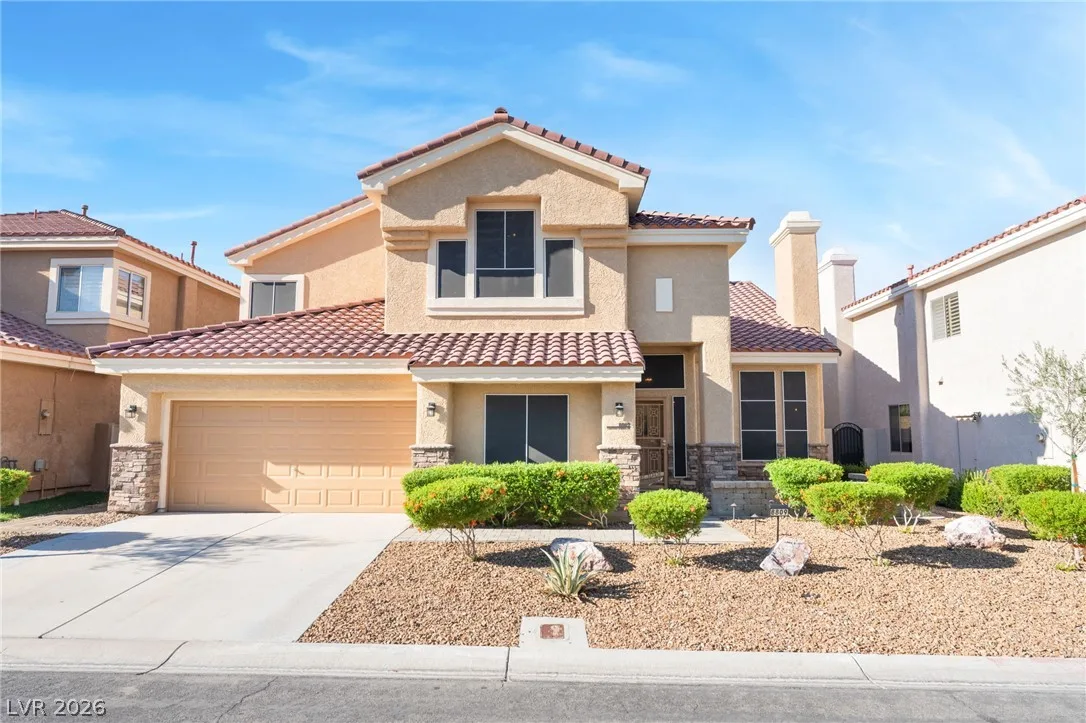
$700,0004 bd3 ba3,063 sqft$229/sqft0.04 mi1 days

$735,0004 bd3 ba3,063 sqft$240/sqft0.07 mi40 daysSold 2026-10-09
$1,000,0003 bd4 ba3,511 sqft$285/sqft0.26 mi22 daysSold 2026-06-10
1829 Dolce DriveSold
$1,225,0003 bd3 ba3,510 sqft$349/sqft0.28 mi18 daysSold 2026-05-15

2423 Denham DriveActive
$679,0003 bd2 ba2,365 sqft$287/sqft0.40 mi43 days
$1,800,0004 bd4 ba3,206 sqft$561/sqft0.48 mi22 daysSold 2026-05-20
$670,0005 bd4 ba3,432 sqft$195/sqft0.48 mi164 daysSold 2026-07-02
$785,0004 bd3 ba2,949 sqft$266/sqft0.51 mi41 daysSold 2026-06-15
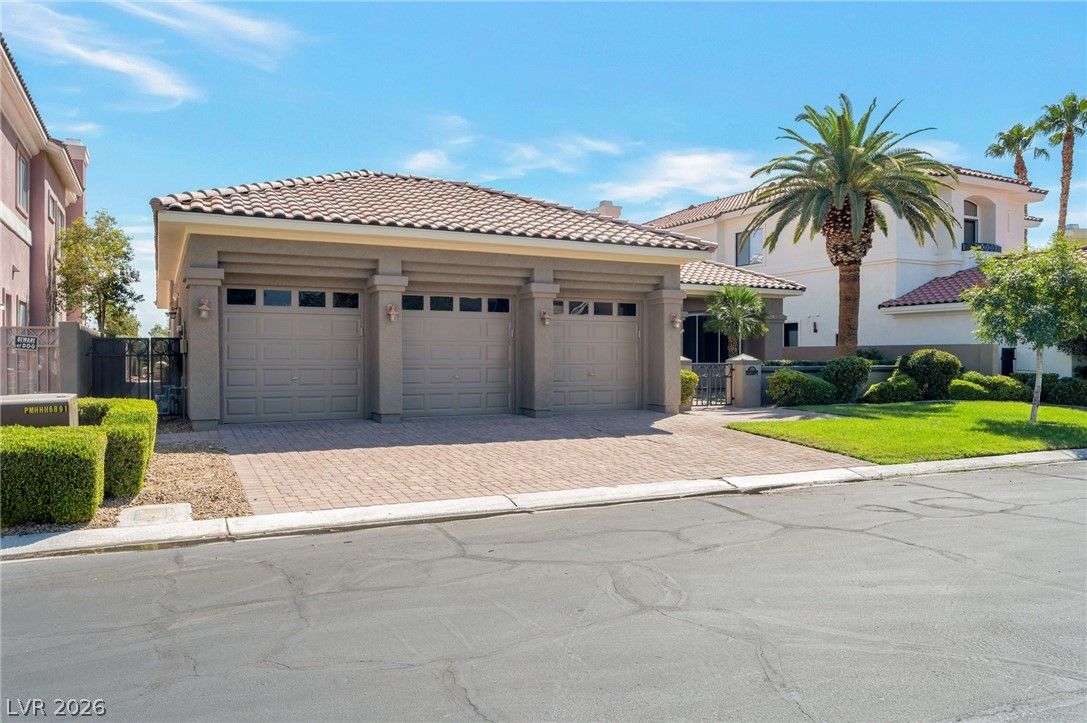
$1,459,1083 bd3 ba3,259 sqft$448/sqft0.52 mi4 daysSold 2026-09-23
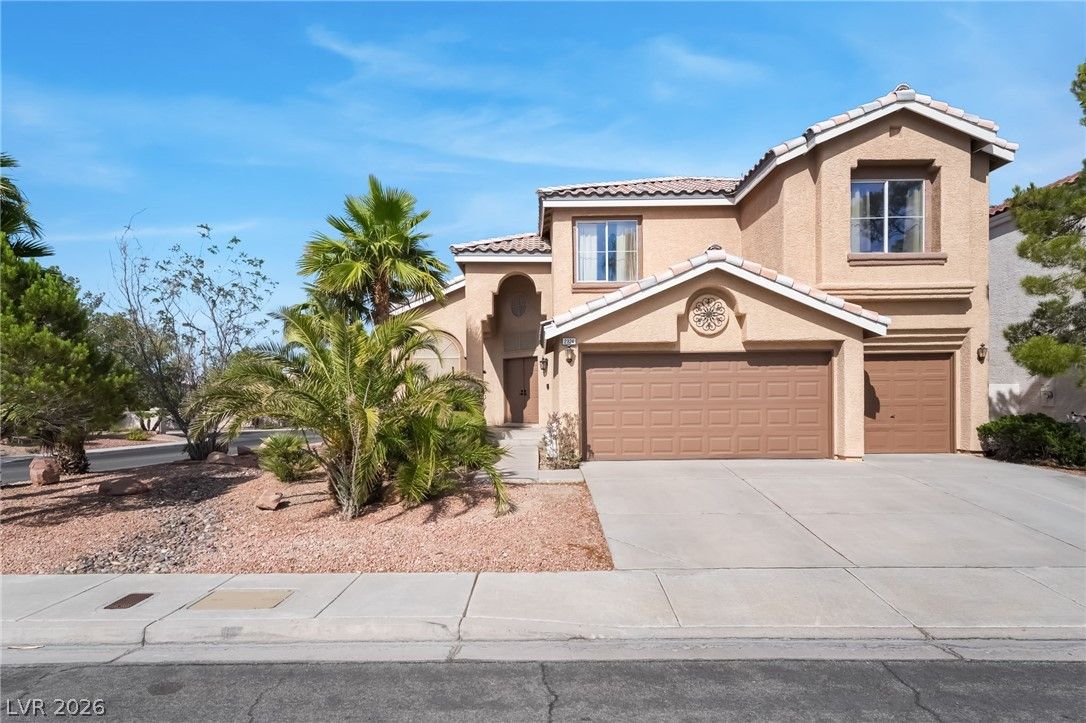
2324 Pinion Valley DriveActive
$599,0004 bd3 ba2,441 sqft$245/sqft0.53 mi30 days
Nearest comparable sales and listings
12 comparables · median price $757,500 · range $599,000 – $1,800,000 · median $/sq ft $279 · average $/sq ft $305
| Address | Status | Price | $/Sq Ft | Bd / Ba | Sq Ft | Sold / market time | Distance |
|---|---|---|---|---|---|---|---|
| 8809 Stafford Springs Drive | Active | $700,000 | $229 | 4 / 3 | 3,063 | 1 days on market | 0.04 mi |
| 2021 Waterbury Lane | Sold | $735,000 | $240 | 4 / 3 | 3,063 | Sold 2026-10-09 | 0.07 mi |
| 8816 Cortile Drive | Sold | $1,000,000 | $285 | 3 / 4 | 3,511 | Sold 2026-06-10 | 0.26 mi |
| 1829 Dolce Drive | Sold | $1,225,000 | $349 | 3 / 3 | 3,510 | Sold 2026-05-15 | 0.28 mi |
| 2423 Denham Drive | Active | $679,000 | $287 | 3 / 2 | 2,365 | 43 days on market | 0.40 mi |
| 1725 Corta Bella Drive | Sold | $1,800,000 | $561 | 4 / 4 | 3,206 | Sold 2026-05-20 | 0.48 mi |
| 2109 Golden Lotus Drive | Sold | $670,000 | $195 | 5 / 4 | 3,432 | Sold 2026-07-02 | 0.48 mi |
| 8528 Estrelita Drive | Sold | $785,000 | $266 | 4 / 3 | 2,949 | Sold 2026-06-15 | 0.51 mi |
| 1708 Wincanton Drive | Sold | $1,459,108 | $448 | 3 / 3 | 3,259 | Sold 2026-09-23 | 0.52 mi |
| 2324 Pinion Valley Drive | Active | $599,000 | $245 | 4 / 3 | 2,441 | 30 days on market | 0.53 mi |
| 1729 Tesara Vista Place | Sold | $780,000 | $278 | 4 / 3 | 2,806 | Sold 2026-06-05 | 0.53 mi |
| 2528 Sunup Drive | Sold | $696,000 | $280 | 3 / 2 | 2,486 | Sold 2026-06-11 | 0.54 mi |


