
Comparable Sales Near 1723 Anchor Drive, North Las Vegas, NV 89032
1st Realty · Comparable sales report · 1st.estate · October 20, 2026
Read the North Las Vegas area guide →
1723 Anchor Drive, North Las Vegas, NV 89032
Status: Sold
$435,000 Sold Price
$241
$ / Sq Ft
1,807
Living Area
6,534 sqft
Lot Size
4
Beds
2
Baths
1994
Year Built
Search Parameters
Property Type
Status
Radius
Sold Within
Beds
Baths
Living Area (Sq Ft)
Lot Size (Sq Ft)
This comp search reflects your current search parameters — adjust the filters above as needed for a more accurate estimate.
Estimated Value
—
Average $/Sqft
—
Check one or more comps below to calculate an estimate.
Nearest 10 of 54 comparable sales and listings within 1 mile of this home. Use the filters above and press Search to refine.
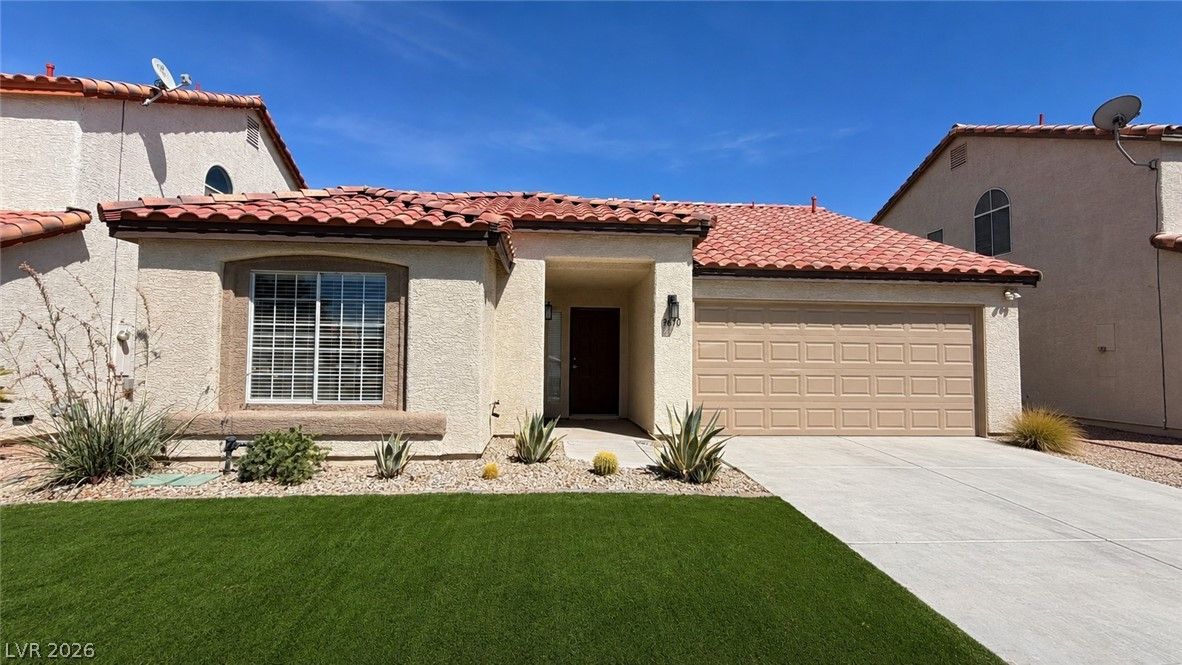
$390,0003 bd2 ba1,696 sqft$230/sqft0.19 mi1 daysSold 2026-09-23
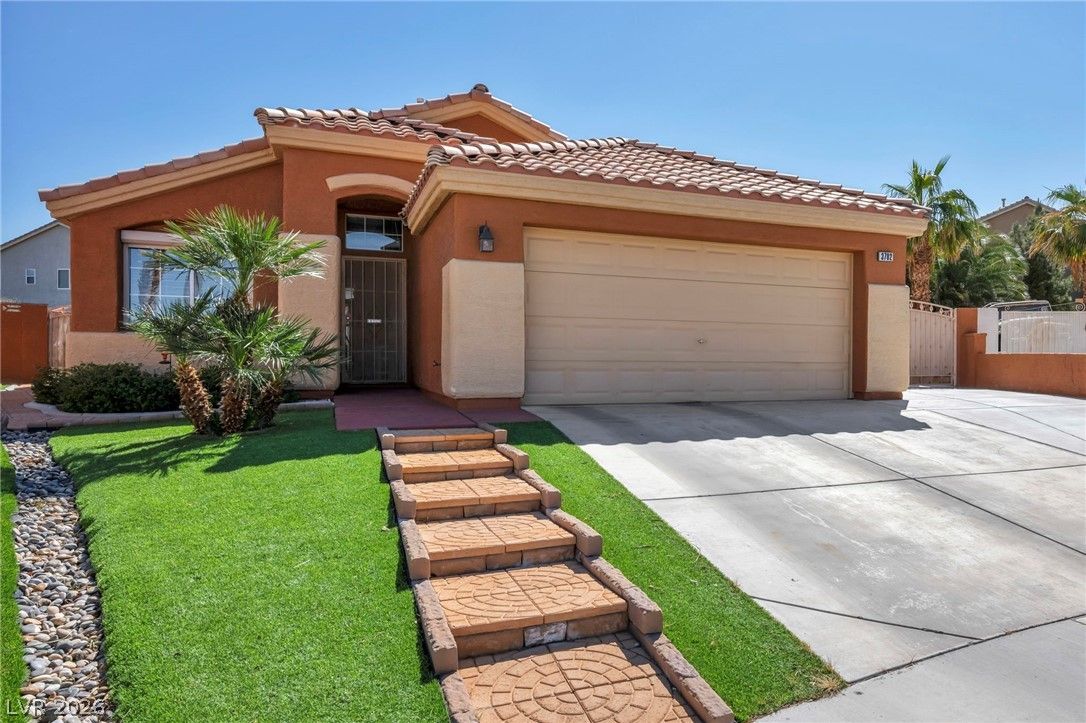
3702 Bizet CourtSold
$435,0003 bd2 ba1,459 sqft$298/sqft0.19 mi84 daysSold 2026-08-05
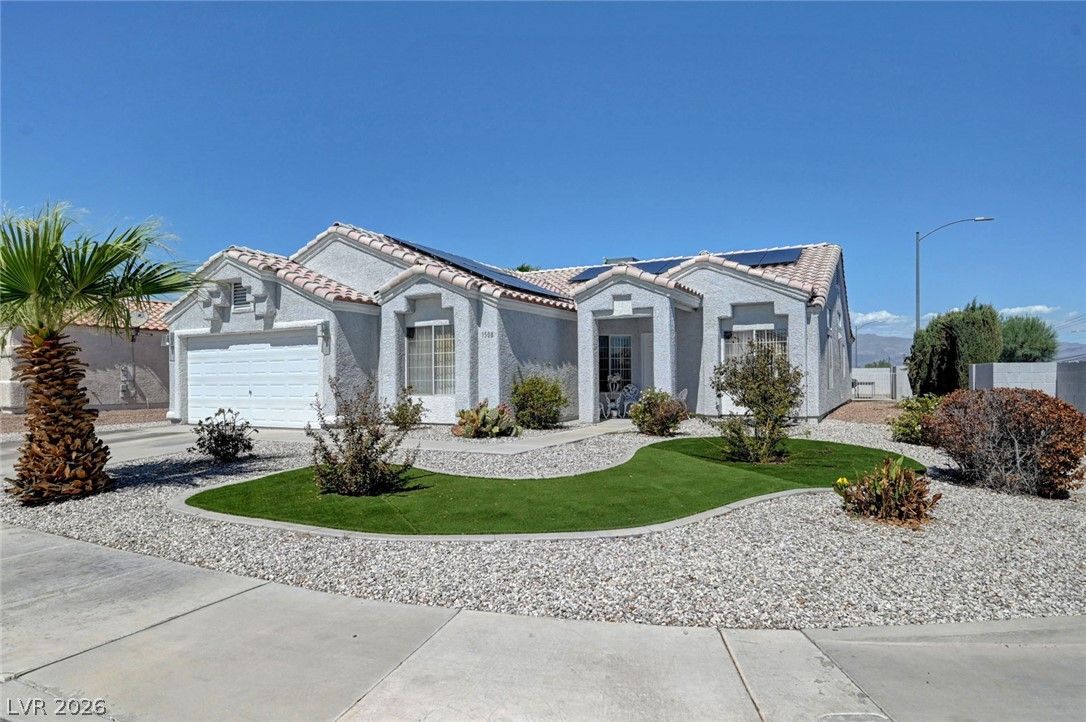
1508 Watercreek DriveActive
$415,0003 bd2 ba1,861 sqft$223/sqft0.20 mi31 days
$469,9004 bd2 ba2,011 sqft$234/sqft0.22 mi63 daysSold 2026-06-22
$400,0003 bd2 ba1,434 sqft$279/sqft0.23 mi5 daysSold 2026-04-27
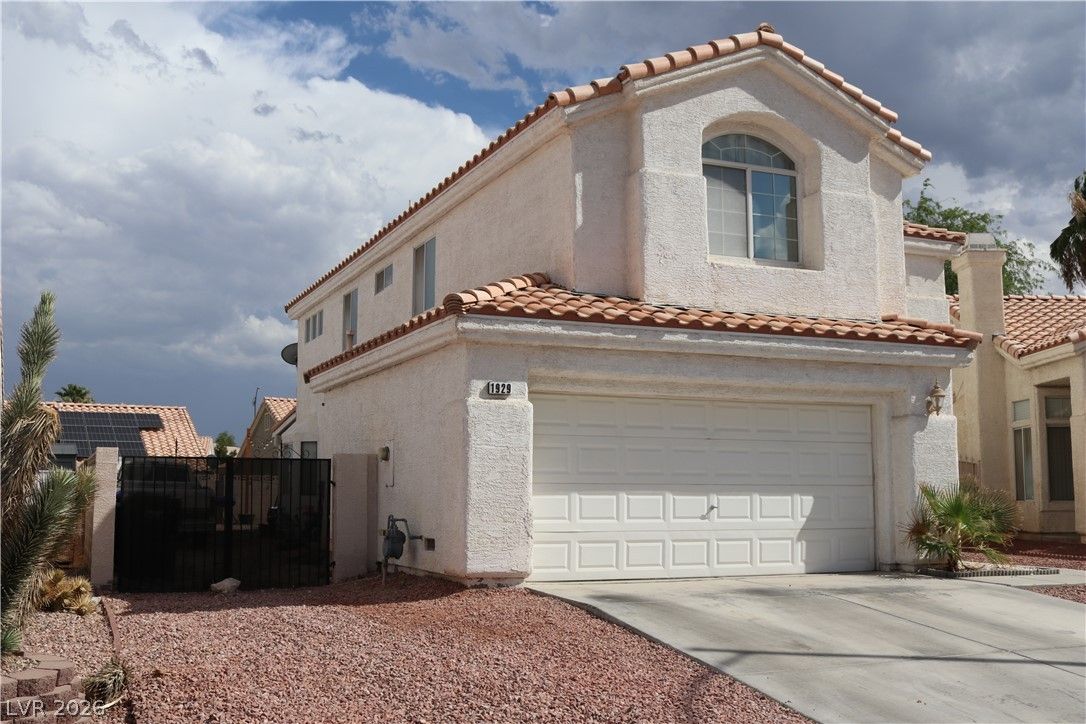
1929 Fan Fare DriveActive
$439,9993 bd3 ba1,996 sqft$220/sqft0.24 mi19 days
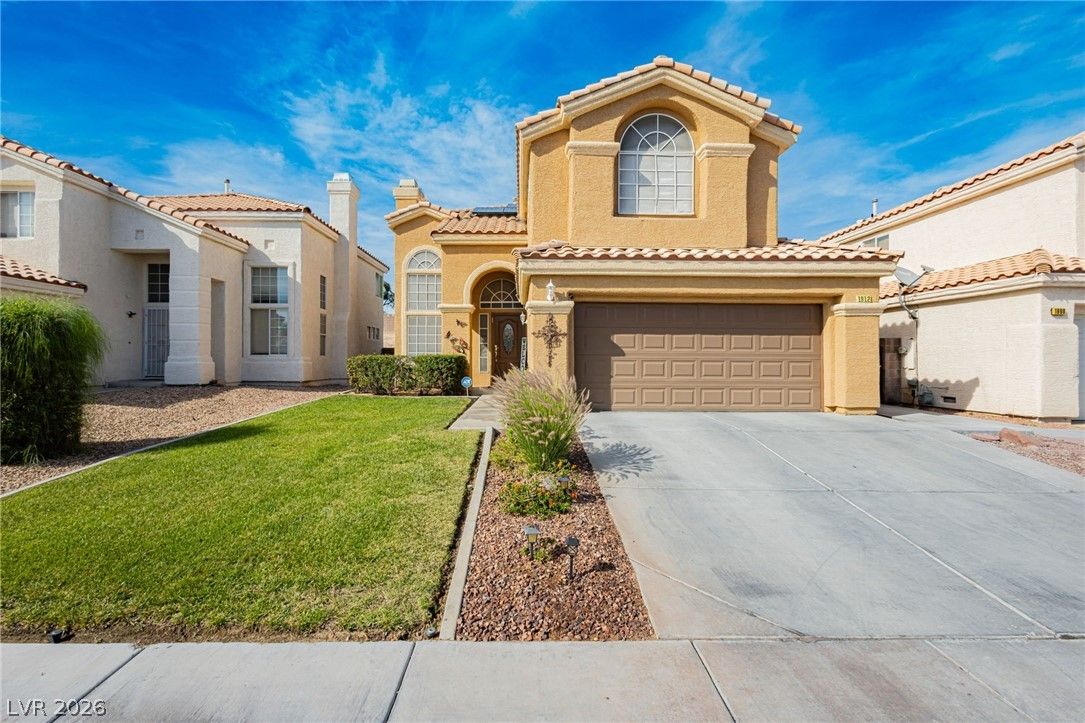
$455,0003 bd3 ba1,996 sqft$228/sqft0.26 mi102 daysSold 2026-08-06
$415,0003 bd2 ba1,581 sqft$262/sqft0.27 mi19 daysSold 2026-05-08
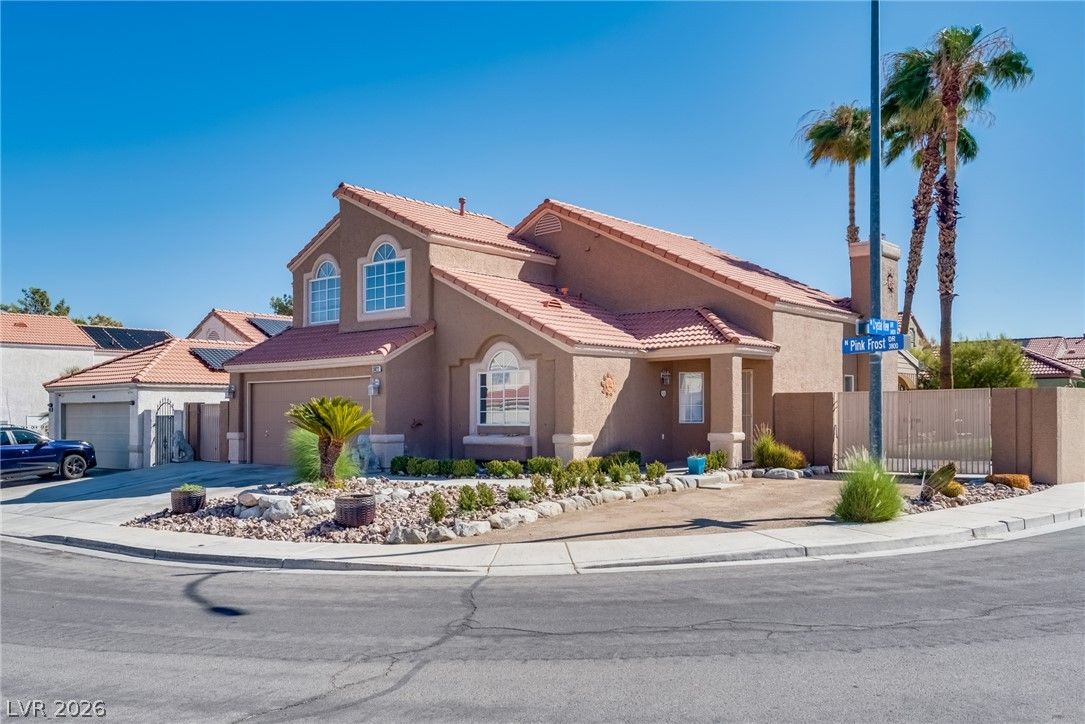
$469,0004 bd3 ba1,822 sqft$257/sqft0.27 mi11 daysSold 2026-09-28
$413,0003 bd2 ba1,581 sqft$261/sqft0.28 mi45 daysSold 2026-06-15
Nearest comparable sales and listings
12 comparables · median price $423,750 · range $390,000 – $469,900 · median $/sq ft $246 · average $/sq ft $250
| Address | Status | Price | $/Sq Ft | Bd / Ba | Sq Ft | Sold / market time | Distance |
|---|---|---|---|---|---|---|---|
| 3610 Quail Creek Drive | Sold | $390,000 | $230 | 3 / 2 | 1,696 | Sold 2026-09-23 | 0.19 mi |
| 3702 Bizet Court | Sold | $435,000 | $298 | 3 / 2 | 1,459 | Sold 2026-08-05 | 0.19 mi |
| 1508 Watercreek Drive | Active | $415,000 | $223 | 3 / 2 | 1,861 | 31 days on market | 0.20 mi |
| 1710 Woodward Heights Way | Sold | $469,900 | $234 | 4 / 2 | 2,011 | Sold 2026-06-22 | 0.22 mi |
| 1618 Woodward Heights Way | Sold | $400,000 | $279 | 3 / 2 | 1,434 | Sold 2026-04-27 | 0.23 mi |
| 1929 Fan Fare Drive | Active | $439,999 | $220 | 3 / 3 | 1,996 | 19 days on market | 0.24 mi |
| 1912 Quartet Drive | Sold | $455,000 | $228 | 3 / 3 | 1,996 | Sold 2026-08-06 | 0.26 mi |
| 3720 Hedge Grove Drive | Sold | $415,000 | $262 | 3 / 2 | 1,581 | Sold 2026-05-08 | 0.27 mi |
| 3822 Pink Frost Drive | Sold | $469,000 | $257 | 4 / 3 | 1,822 | Sold 2026-09-28 | 0.27 mi |
| 3719 Glacier Grove Drive | Sold | $413,000 | $261 | 3 / 2 | 1,581 | Sold 2026-06-15 | 0.28 mi |
| 3825 Debussy Way | Sold | $417,500 | $286 | 3 / 2 | 1,459 | Sold 2026-07-31 | 0.29 mi |
| 3836 Iverson Lane | Sold | $430,000 | $218 | 3 / 2 | 1,977 | Sold 2026-06-30 | 0.34 mi |


