
Comparable Sales Near 4844 Maryvale Drive, Las Vegas, NV 89130
1st Realty · Comparable sales report · 1st.estate · October 20, 2026
Browse our Las Vegas area guides →
4844 Maryvale Drive, Las Vegas, NV 89130
Status: Sold
$2,100 Sold Price
$1
$ / Sq Ft
1,892
Living Area
4,356 sqft
Lot Size
4
Beds
3
Baths
1989
Year Built
Search Parameters
Property Type
Status
Radius
Sold Within
Beds
Baths
Living Area (Sq Ft)
Lot Size (Sq Ft)
This comp search reflects your current search parameters — adjust the filters above as needed for a more accurate estimate.
Estimated Value
—
Average $/Sqft
—
Check one or more comps below to calculate an estimate.
Nearest 10 of 19 comparable sales and listings within 1 mile of this home. Use the filters above and press Search to refine.
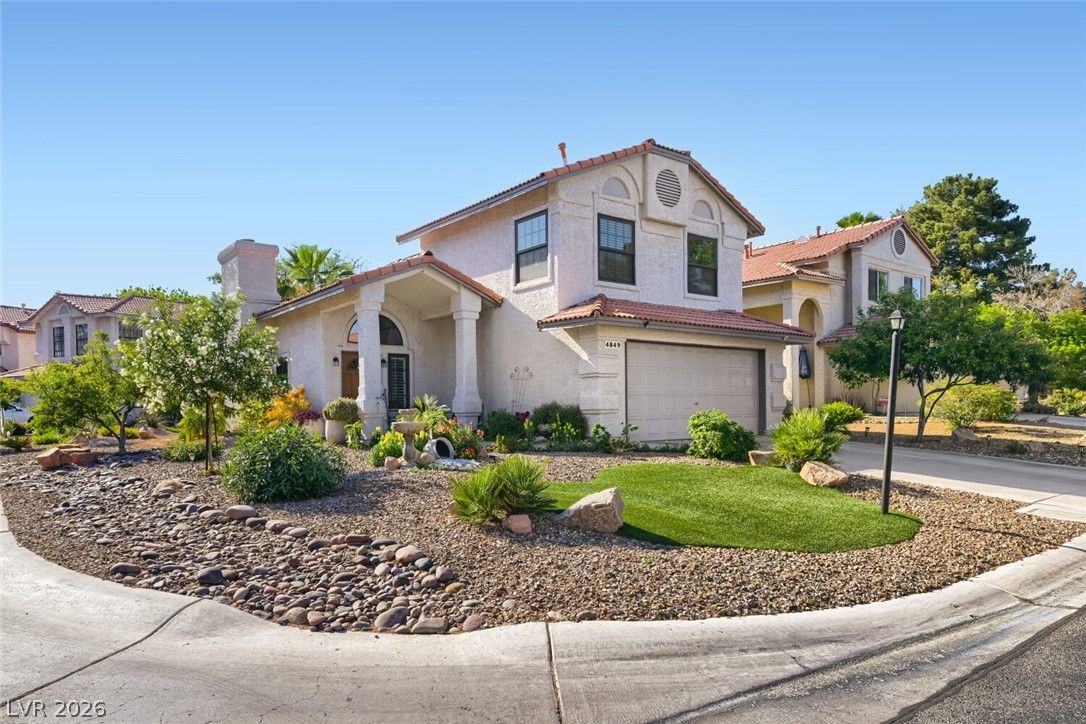
4849 Maryvale DriveActive
$435,9004 bd3 ba1,794 sqft$243/sqft0.03 mi0 days
$416,0004 bd3 ba1,794 sqft$232/sqft0.06 mi109 daysSold 2026-06-16
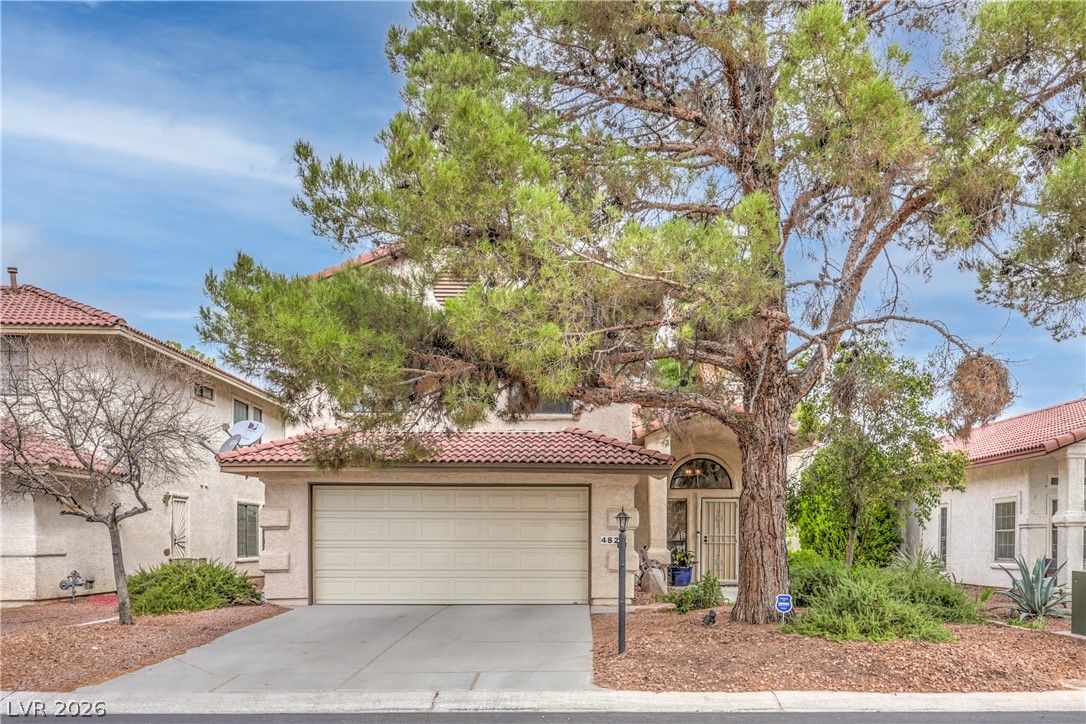
4829 Friar LaneSold
$415,0003 bd3 ba1,794 sqft$231/sqft0.07 mi3 daysSold 2026-08-27
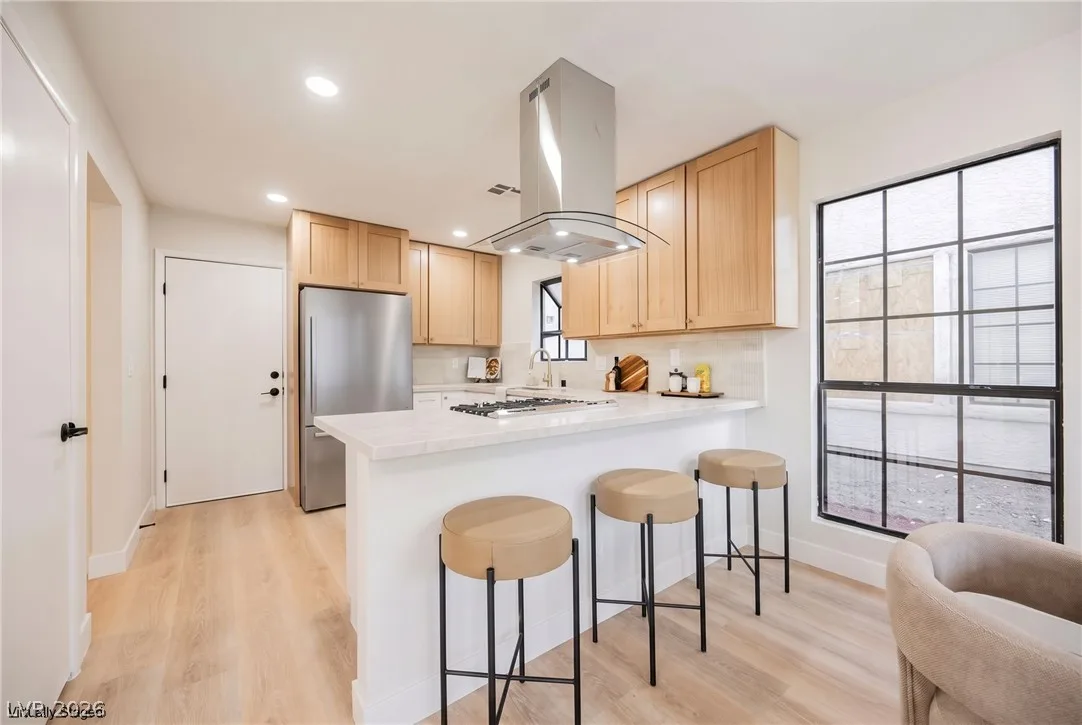
4877 Fiesta Lakes StreetActive
$429,9953 bd3 ba1,584 sqft$271/sqft0.08 mi0 days
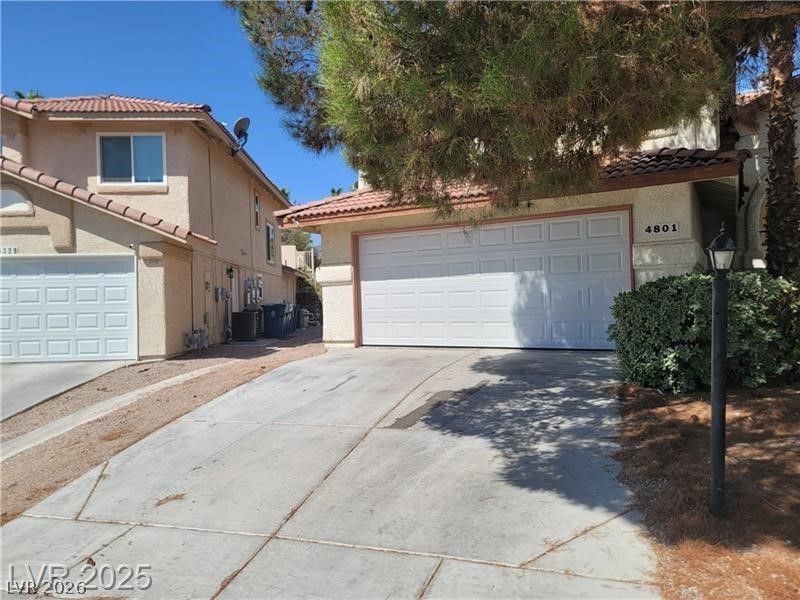
4801 Fiesta Lakes StreetActive
$459,9003 bd3 ba1,584 sqft$290/sqft0.17 mi2 days
$410,0003 bd2 ba1,486 sqft$276/sqft0.44 mi6 daysSold 2026-07-01
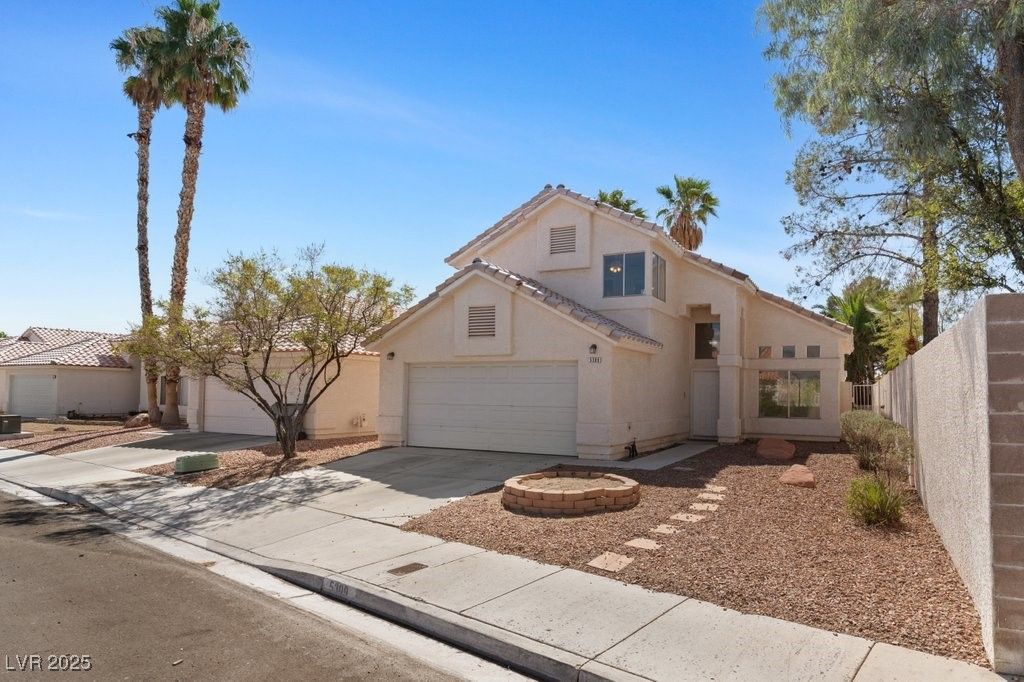
$389,9003 bd3 ba1,630 sqft$239/sqft0.47 mi274 daysSold 2026-08-13
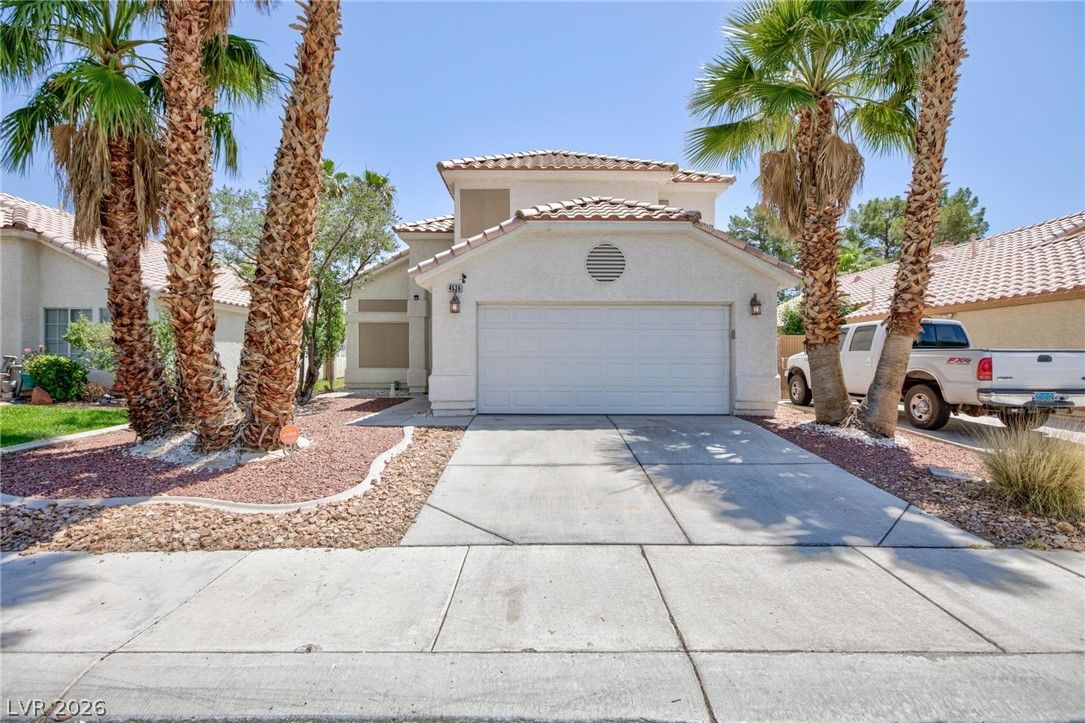
$393,0003 bd3 ba1,630 sqft$241/sqft0.50 mi44 daysSold 2026-09-23
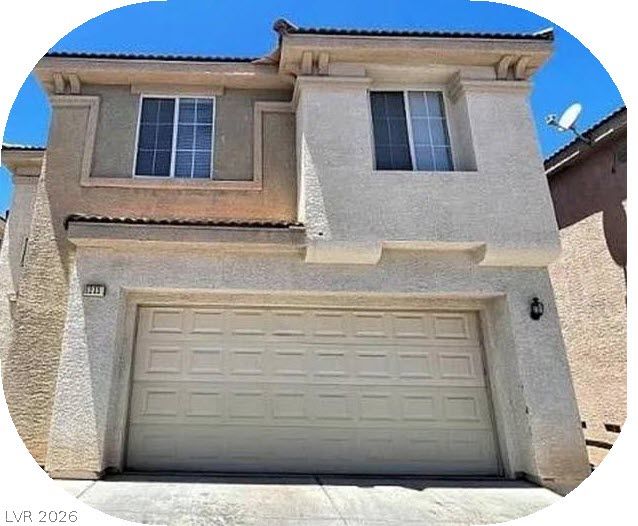
5213 Castle Butte CourtActive
$499,9004 bd3 ba2,211 sqft$226/sqft0.59 mi4 days
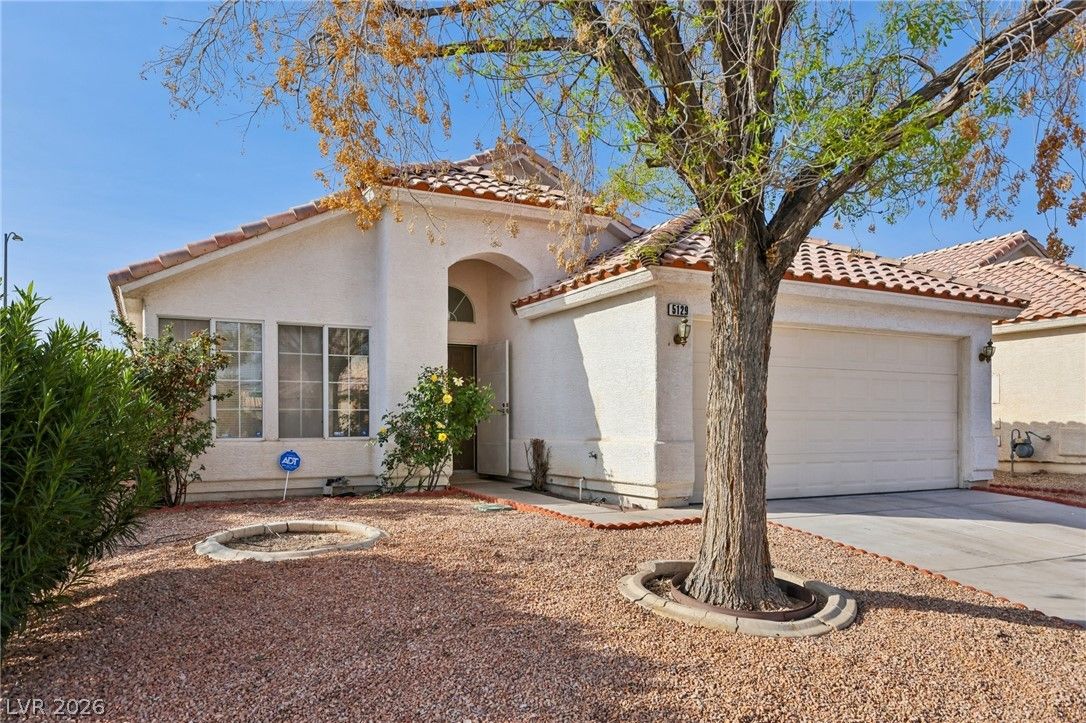
$377,5003 bd2 ba1,486 sqft$254/sqft0.62 mi8 daysSold 2026-05-29
Nearest comparable sales and listings
12 comparables · median price $415,500 · range $377,500 – $499,900 · median $/sq ft $242 · average $/sq ft $249
| Address | Status | Price | $/Sq Ft | Bd / Ba | Sq Ft | Sold / market time | Distance |
|---|---|---|---|---|---|---|---|
| 4849 Maryvale Drive | Active | $435,900 | $243 | 4 / 3 | 1,794 | 0 days on market | 0.03 mi |
| 4872 Maryvale Drive | Sold | $416,000 | $232 | 4 / 3 | 1,794 | Sold 2026-06-16 | 0.06 mi |
| 4829 Friar Lane | Sold | $415,000 | $231 | 3 / 3 | 1,794 | Sold 2026-08-27 | 0.07 mi |
| 4877 Fiesta Lakes Street | Active | $429,995 | $271 | 3 / 3 | 1,584 | 0 days on market | 0.08 mi |
| 4801 Fiesta Lakes Street | Active | $459,900 | $290 | 3 / 3 | 1,584 | 2 days on market | 0.17 mi |
| 5112 Camino Del Rancho | Sold | $410,000 | $276 | 3 / 2 | 1,486 | Sold 2026-07-01 | 0.44 mi |
| 5309 Camino Del Rancho | Sold | $389,900 | $239 | 3 / 3 | 1,630 | Sold 2026-08-13 | 0.47 mi |
| 4536 Del Pappa Court | Sold | $393,000 | $241 | 3 / 3 | 1,630 | Sold 2026-09-23 | 0.50 mi |
| 5213 Castle Butte Court | Active | $499,900 | $226 | 4 / 3 | 2,211 | 4 days on market | 0.59 mi |
| 5129 Brookmere Drive | Sold | $377,500 | $254 | 3 / 2 | 1,486 | Sold 2026-05-29 | 0.62 mi |
| 4925 Cedar Lawn Way | Under Contract | $424,900 | $262 | 3 / 2 | 1,624 | 3 days on market | 0.70 mi |
| 4635 Abbottwood Avenue | Sold | $395,000 | $219 | 3 / 3 | 1,805 | Sold 2026-08-31 | 0.72 mi |


