
Comparable Sales Near 1712 Chapman Drive, Las Vegas, NV 89104
1st Realty · Comparable sales report · 1st.estate · October 20, 2026
Browse our Las Vegas area guides →
1712 Chapman Drive, Las Vegas, NV 89104
Status: Sold
$650,000 Sold Price
$288
$ / Sq Ft
2,256
Living Area
11,326 sqft
Lot Size
3
Beds
3
Baths
1964
Year Built
Search Parameters
Property Type
Status
Radius
Sold Within
Beds
Baths
Living Area (Sq Ft)
Lot Size (Sq Ft)
This comp search reflects your current search parameters — adjust the filters above as needed for a more accurate estimate.
Estimated Value
—
Average $/Sqft
—
Check one or more comps below to calculate an estimate.
Nearest 10 of 14 comparable sales and listings within 1 mile of this home. Use the filters above and press Search to refine.
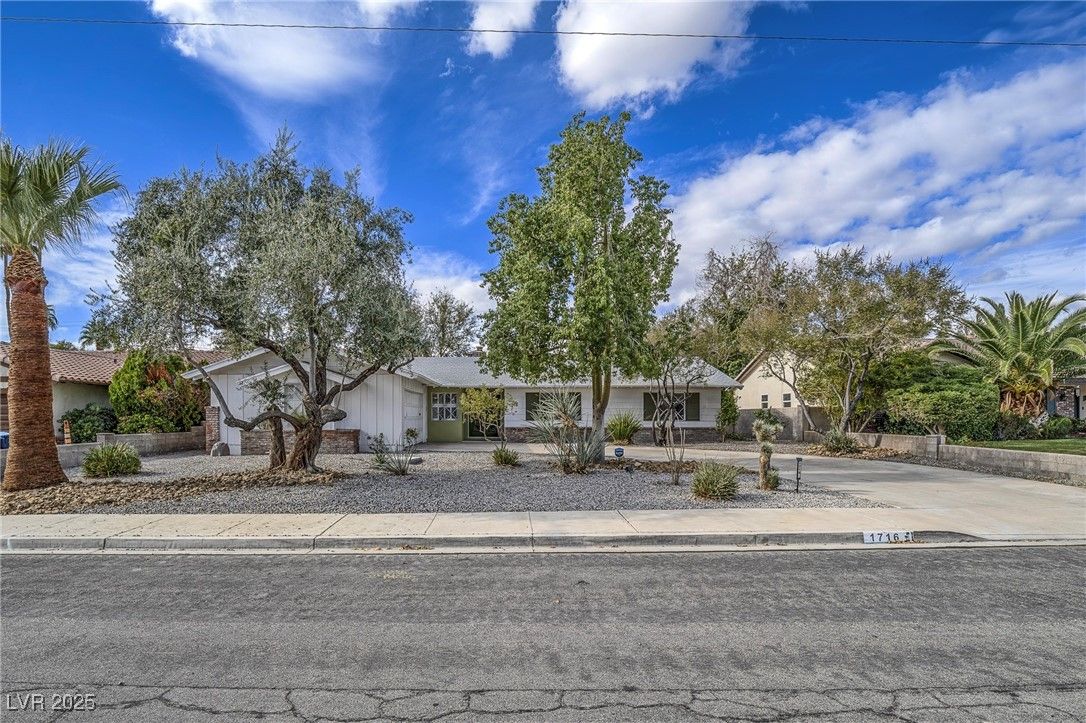
1716 Chapman DriveActive
$627,0003 bd2 ba2,271 sqft$276/sqft0.01 mi127 days
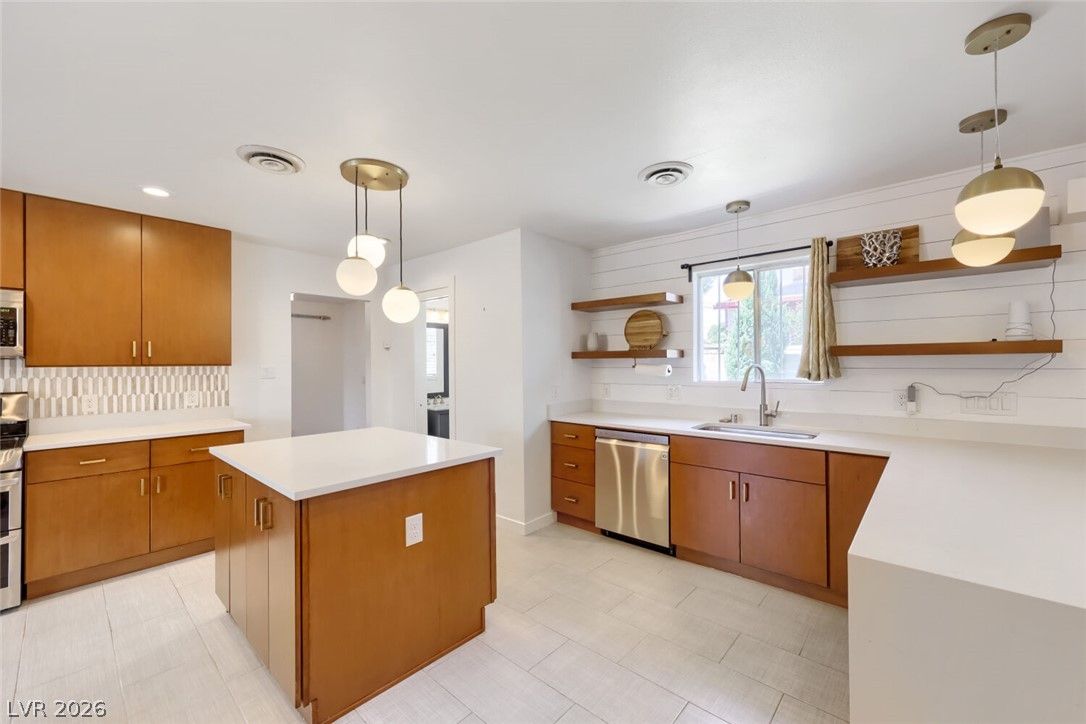
1620 South 15th StreetActive
$670,0004 bd3 ba2,732 sqft$245/sqft0.07 mi104 days
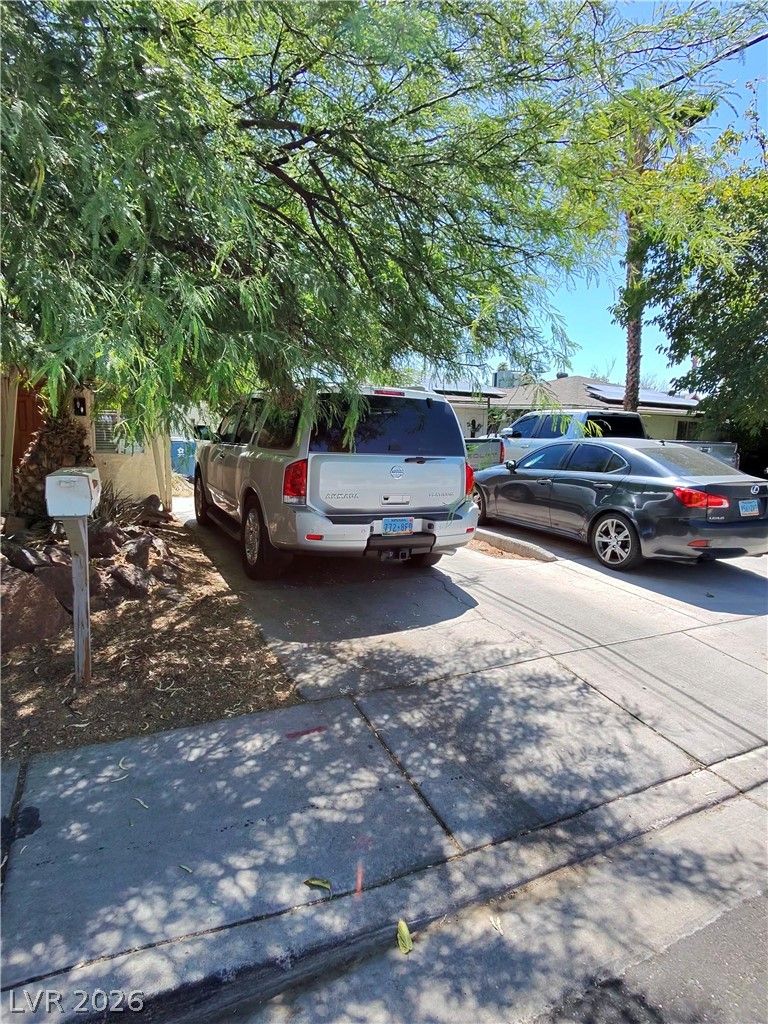
1217 South 10th StreetUnder Contract
$250,0003 bd3 ba2,554 sqft$98/sqft0.61 mi27 days
1815 8th PlaceSold
$650,0004 bd3 ba2,511 sqft$259/sqft0.63 mi26 daysSold 2026-07-15
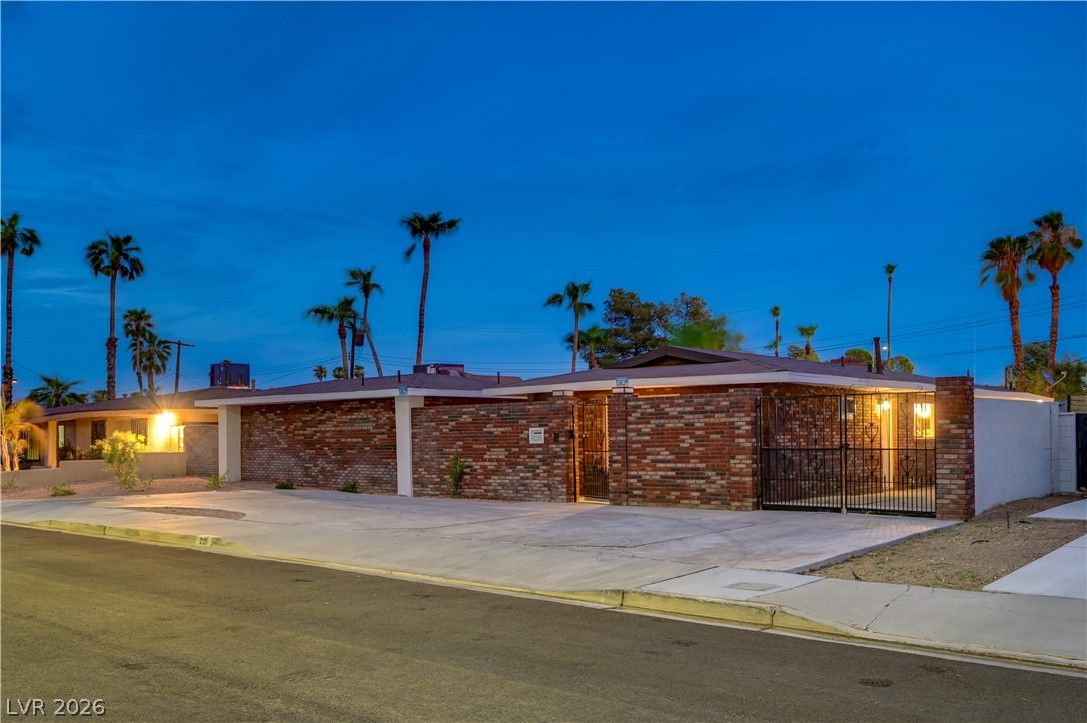
2101 Santiago StreetActive
$527,0004 bd3 ba2,274 sqft$232/sqft0.69 mi45 days
$550,0003 bd3 ba2,006 sqft$274/sqft0.70 mi10 daysSold 2026-05-27
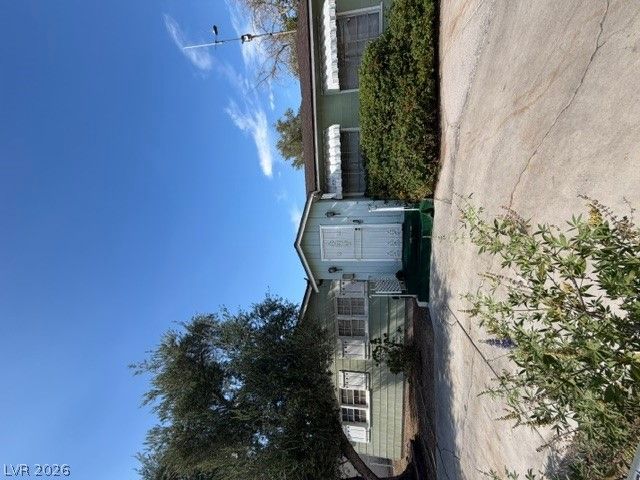
1929 Ballard DriveActive
$289,5004 bd3 ba2,418 sqft$120/sqft0.75 mi50 days
$829,0003 bd3 ba2,774 sqft$299/sqft0.78 mi29 daysSold 2026-05-26
709 Park PaseoSold
$462,0003 bd3 ba2,202 sqft$210/sqft0.83 mi6 daysSold 2026-07-15
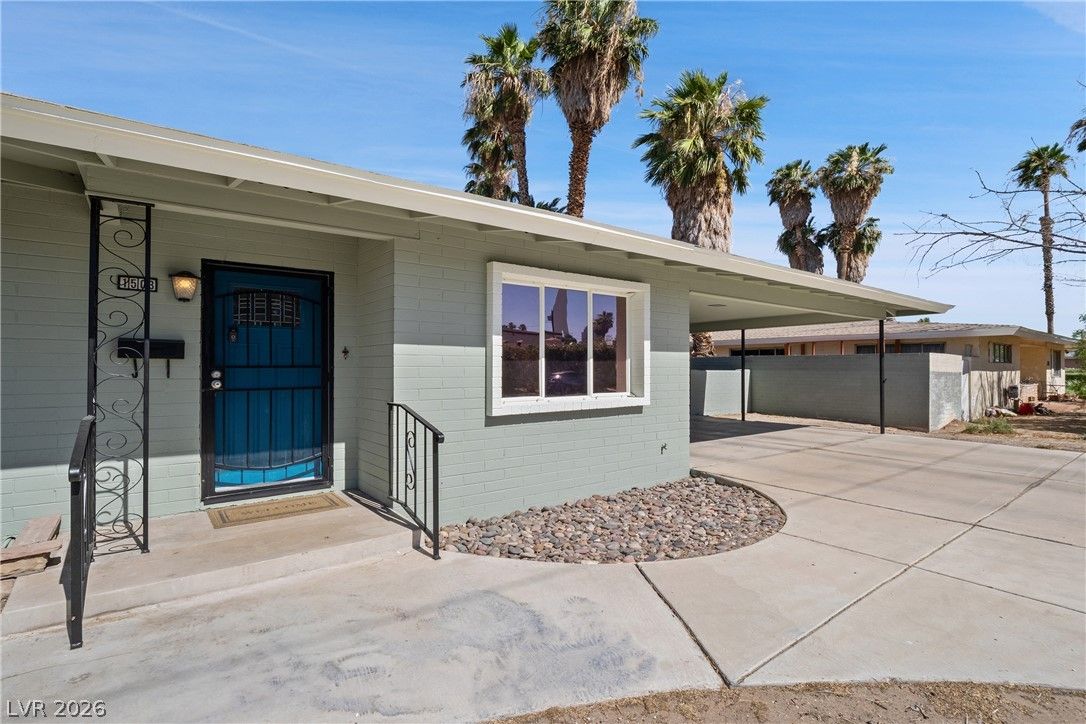
1503 5th PlaceSold
$500,0003 bd3 ba2,508 sqft$199/sqft0.84 mi100 daysSold 2026-08-31
Nearest comparable sales and listings
12 comparables · median price $538,500 · range $250,000 – $829,000 · median $/sq ft $238 · average $/sq ft $226
| Address | Status | Price | $/Sq Ft | Bd / Ba | Sq Ft | Sold / market time | Distance |
|---|---|---|---|---|---|---|---|
| 1716 Chapman Drive | Active | $627,000 | $276 | 3 / 2 | 2,271 | 127 days on market | 0.01 mi |
| 1620 South 15th Street | Active | $670,000 | $245 | 4 / 3 | 2,732 | 104 days on market | 0.07 mi |
| 1217 South 10th Street | Under Contract | $250,000 | $98 | 3 / 3 | 2,554 | 27 days on market | 0.61 mi |
| 1815 8th Place | Sold | $650,000 | $259 | 4 / 3 | 2,511 | Sold 2026-07-15 | 0.63 mi |
| 2101 Santiago Street | Active | $527,000 | $232 | 4 / 3 | 2,274 | 45 days on market | 0.69 mi |
| 808 East Saint Louis Avenue | Sold | $550,000 | $274 | 3 / 3 | 2,006 | Sold 2026-05-27 | 0.70 mi |
| 1929 Ballard Drive | Active | $289,500 | $120 | 4 / 3 | 2,418 | 50 days on market | 0.75 mi |
| 1601 South 6 Street | Sold | $829,000 | $299 | 3 / 3 | 2,774 | Sold 2026-05-26 | 0.78 mi |
| 709 Park Paseo | Sold | $462,000 | $210 | 3 / 3 | 2,202 | Sold 2026-07-15 | 0.83 mi |
| 1503 5th Place | Sold | $500,000 | $199 | 3 / 3 | 2,508 | Sold 2026-08-31 | 0.84 mi |
| 521 Sweeney Avenue | Sold | $445,000 | $213 | 4 / 2 | 2,093 | Sold 2026-06-23 | 0.90 mi |
| 554 Canosa Avenue | Active | $585,000 | $285 | 3 / 2 | 2,051 | 147 days on market | 0.91 mi |


