
Comparable Sales Near 60 Pecos Street, Las Vegas, NV 89110
1st Realty · Comparable sales report · 1st.estate · October 21, 2026
Browse our Las Vegas area guides →
60 Pecos Street, Las Vegas, NV 89110
Status: Sold
$485,000 Sold Price
$276
$ / Sq Ft
1,760
Living Area
7,840 sqft
Lot Size
4
Beds
2
Baths
2024
Year Built
Search Parameters
Property Type
Status
Radius
Sold Within
Beds
Baths
Living Area (Sq Ft)
Lot Size (Sq Ft)
This comp search reflects your current search parameters — adjust the filters above as needed for a more accurate estimate.
Estimated Value
—
Average $/Sqft
—
Check one or more comps below to calculate an estimate.
Nearest 10 of 14 comparable sales and listings within 1 mile of this home. Use the filters above and press Search to refine.
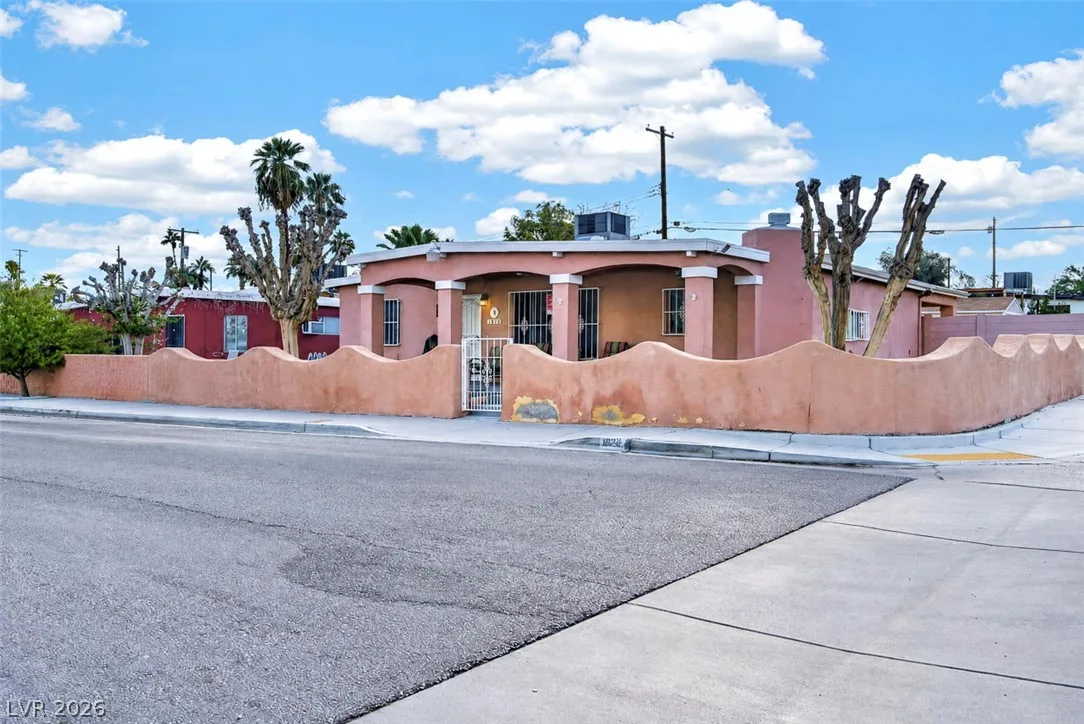
1323 Maui StreetActive
$349,0004 bd1 ba1,379 sqft$253/sqft0.33 mi0 days
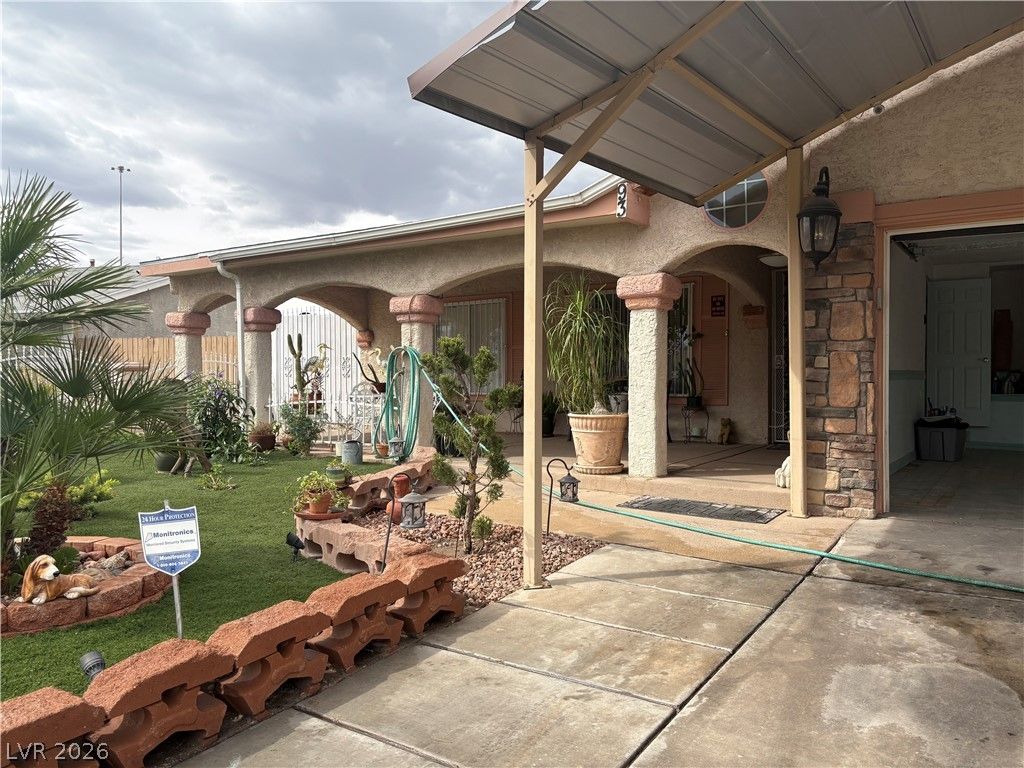
$425,0004 bd3 ba1,657 sqft$256/sqft0.37 mi23 daysSold 2026-09-21
34 Del Amo DriveSold
$295,1133 bd2 ba1,424 sqft$207/sqft0.48 mi21 daysSold 2026-06-02
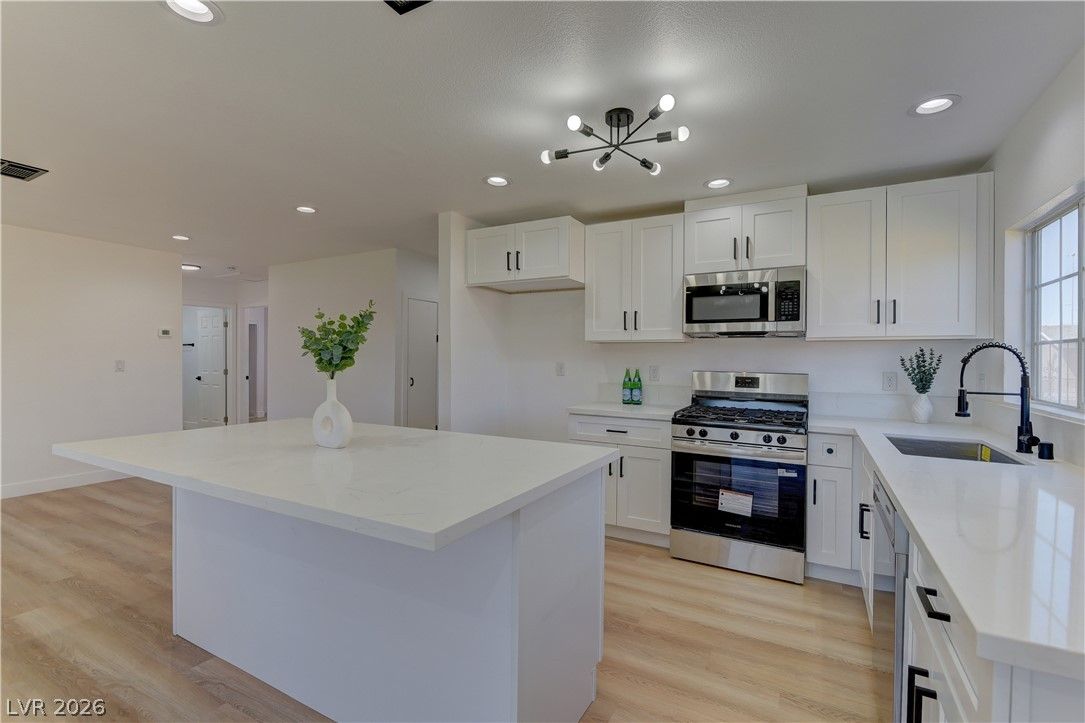
34 Del Amo DriveSold
$379,0003 bd2 ba1,424 sqft$266/sqft0.48 mi13 daysSold 2026-09-29

3926 Arizona AvenueActive
$390,0004 bd2 ba1,358 sqft$287/sqft0.60 mi52 days
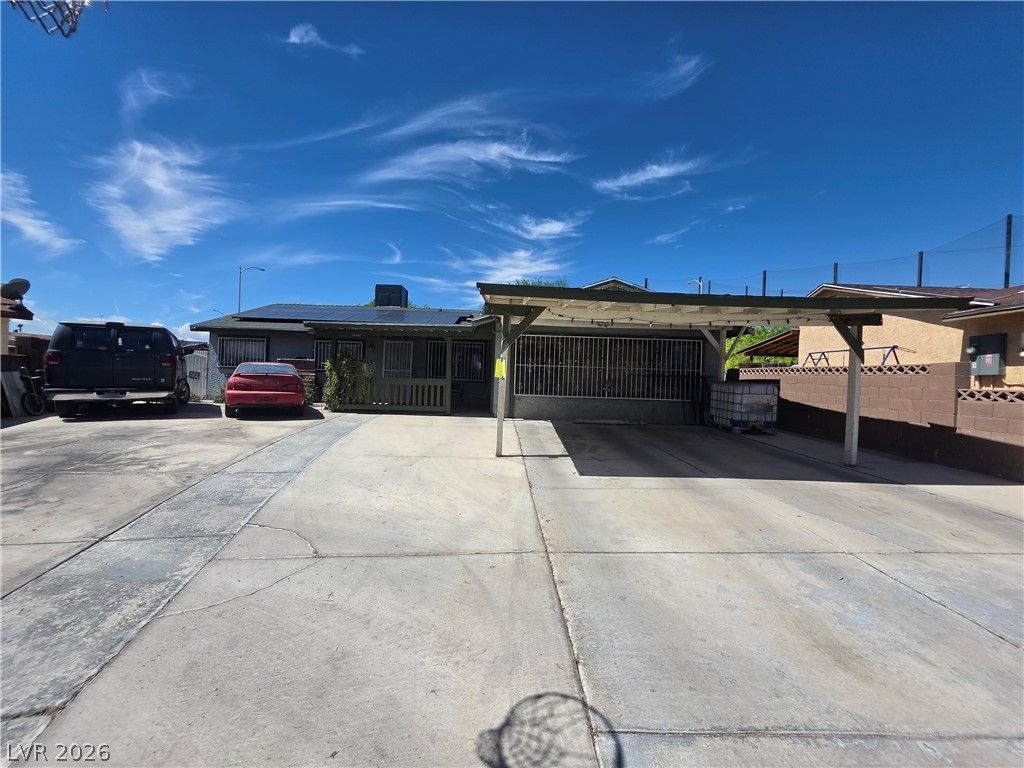
500 Kuilima RoadActive
$359,0004 bd3 ba1,542 sqft$233/sqft0.60 mi0 days
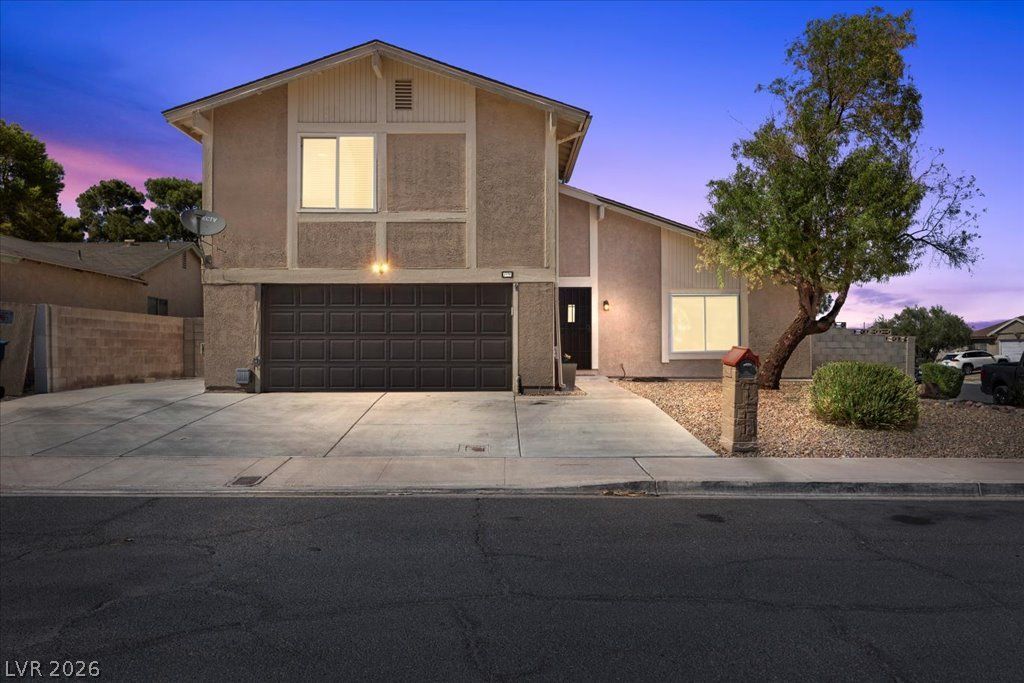
$395,0004 bd3 ba1,562 sqft$253/sqft0.67 mi8 daysSold 2026-09-24
224 Prince LaneSold
$390,0004 bd3 ba1,550 sqft$252/sqft0.77 mi6 daysSold 2026-07-02
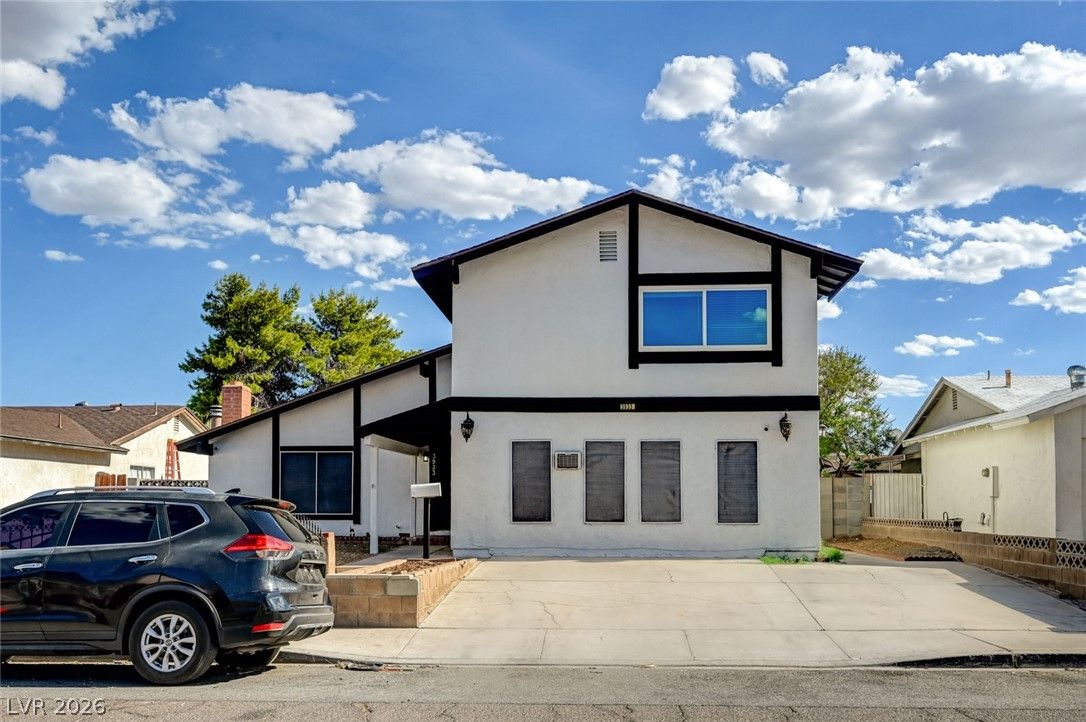
3933 Manford CircleActive
$484,0005 bd3 ba2,024 sqft$239/sqft0.78 mi52 days
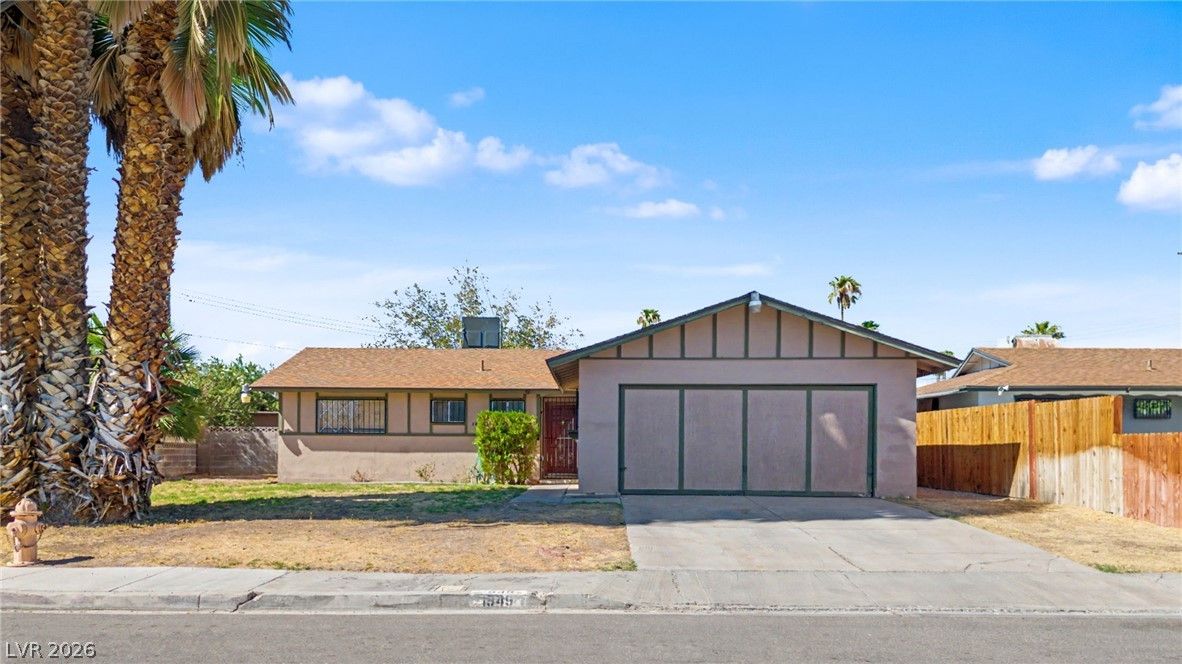
1949 Randa LaneActive
$374,9004 bd2 ba1,539 sqft$244/sqft0.81 mi0 days
Nearest comparable sales and listings
12 comparables · median price $376,950 · range $290,000 – $484,000 · median $/sq ft $248 · average $/sq ft $238
| Address | Status | Price | $/Sq Ft | Bd / Ba | Sq Ft | Sold / market time | Distance |
|---|---|---|---|---|---|---|---|
| 1323 Maui Street | Active | $349,000 | $253 | 4 / 1 | 1,379 | 0 days on market | 0.33 mi |
| 93 Vallejo Avenue | Sold | $425,000 | $256 | 4 / 3 | 1,657 | Sold 2026-09-21 | 0.37 mi |
| 34 Del Amo Drive | Sold | $295,113 | $207 | 3 / 2 | 1,424 | Sold 2026-06-02 | 0.48 mi |
| 34 Del Amo Drive | Sold | $379,000 | $266 | 3 / 2 | 1,424 | Sold 2026-09-29 | 0.48 mi |
| 3926 Arizona Avenue | Active | $390,000 | $287 | 4 / 2 | 1,358 | 52 days on market | 0.60 mi |
| 500 Kuilima Road | Active | $359,000 | $233 | 4 / 3 | 1,542 | 0 days on market | 0.60 mi |
| 3970 Delling Court | Sold | $395,000 | $253 | 4 / 3 | 1,562 | Sold 2026-09-24 | 0.67 mi |
| 224 Prince Lane | Sold | $390,000 | $252 | 4 / 3 | 1,550 | Sold 2026-07-02 | 0.77 mi |
| 3933 Manford Circle | Active | $484,000 | $239 | 5 / 3 | 2,024 | 52 days on market | 0.78 mi |
| 1949 Randa Lane | Active | $374,900 | $244 | 4 / 2 | 1,539 | 0 days on market | 0.81 mi |
| 50 North 27th Street | Sold | $290,000 | $192 | 3 / 2 | 1,513 | Sold 2026-08-24 | 0.85 mi |
| 428 Bolsa Drive | Active | $300,000 | $173 | 4 / 2 | 1,731 | 0 days on market | 0.89 mi |


