
Comparable Sales Near 5219 Ocala Lane, Las Vegas, NV 89122
1st Realty · Comparable sales report · 1st.estate · October 20, 2026
Browse our Las Vegas area guides →
5219 Ocala Lane, Las Vegas, NV 89122
Status: Sold
$274,900 Sold Price
$170
$ / Sq Ft
1,620
Living Area
5,227 sqft
Lot Size
2
Beds
3
Baths
1978
Year Built
Search Parameters
Property Type
Status
Radius
Sold Within
Beds
Baths
Living Area (Sq Ft)
Lot Size (Sq Ft)
This comp search reflects your current search parameters — adjust the filters above as needed for a more accurate estimate.
Estimated Value
—
Average $/Sqft
—
Check one or more comps below to calculate an estimate.
Nearest 10 of 91 comparable sales and listings within 1 mile of this home. Use the filters above and press Search to refine.
$270,0003 bd2 ba1,904 sqft$142/sqft0.08 mi20 daysSold 2026-05-18
$265,0003 bd2 ba1,368 sqft$194/sqft0.13 mi63 daysSold 2026-05-22
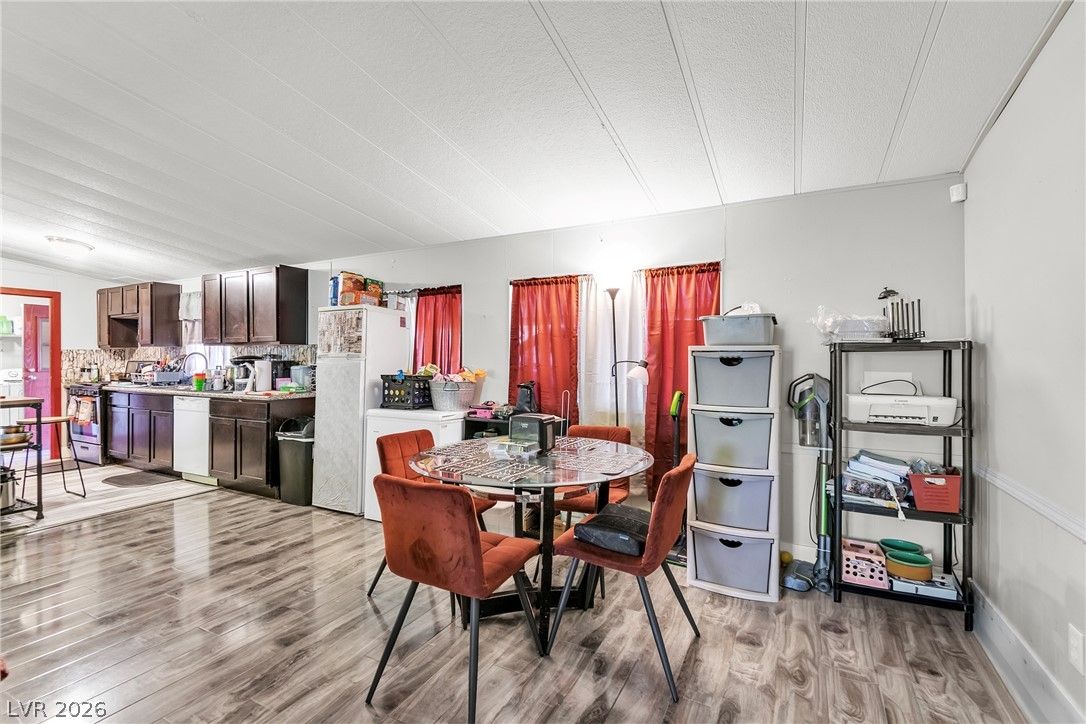
3659 Death Valley DriveActive
$240,0003 bd2 ba1,344 sqft$179/sqft0.14 mi17 days
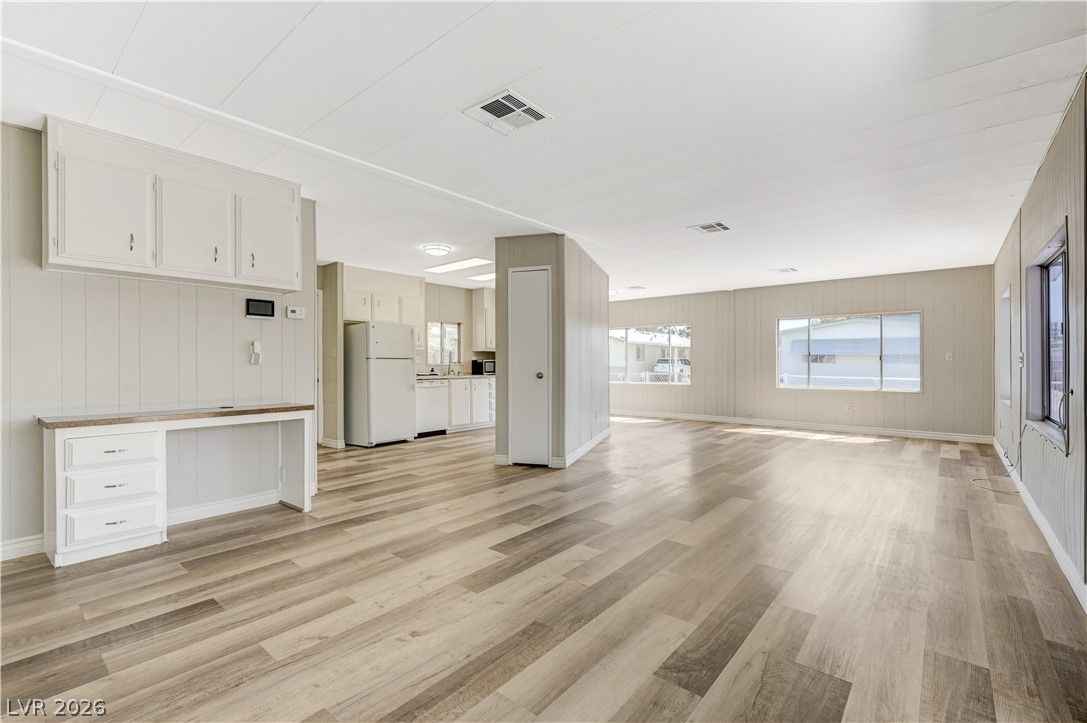
3619 Katmai DriveActive
$189,5002 bd2 ba1,344 sqft$141/sqft0.16 mi95 days
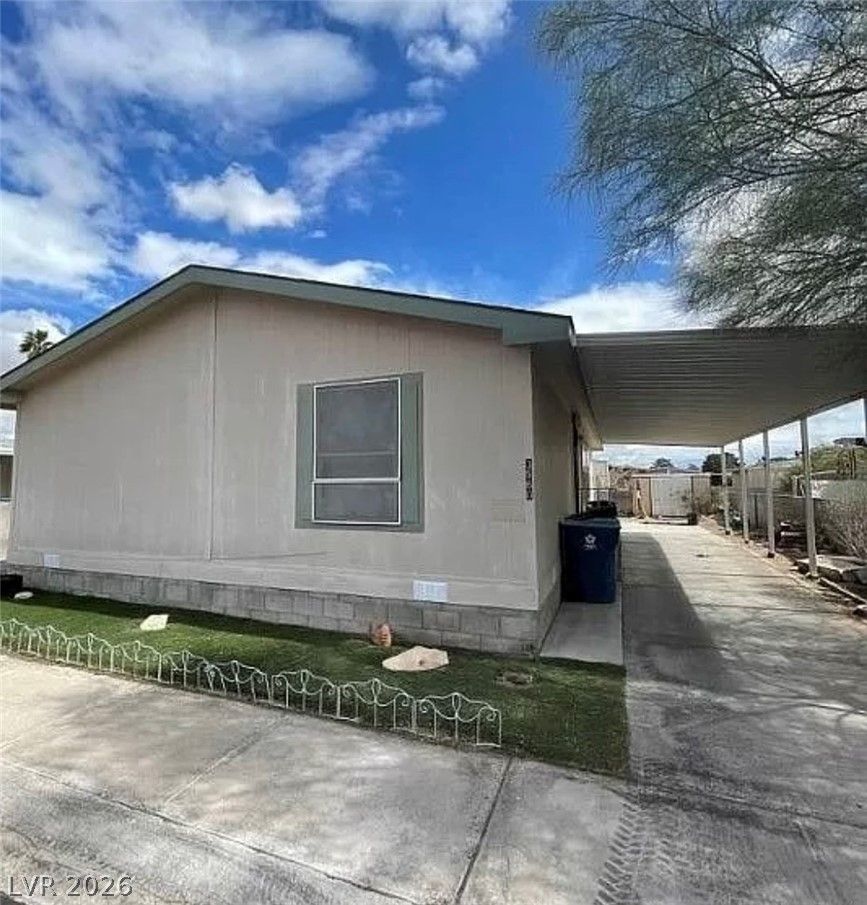
3560 Estes Park DriveActive
$289,9003 bd2 ba1,377 sqft$211/sqft0.17 mi0 days
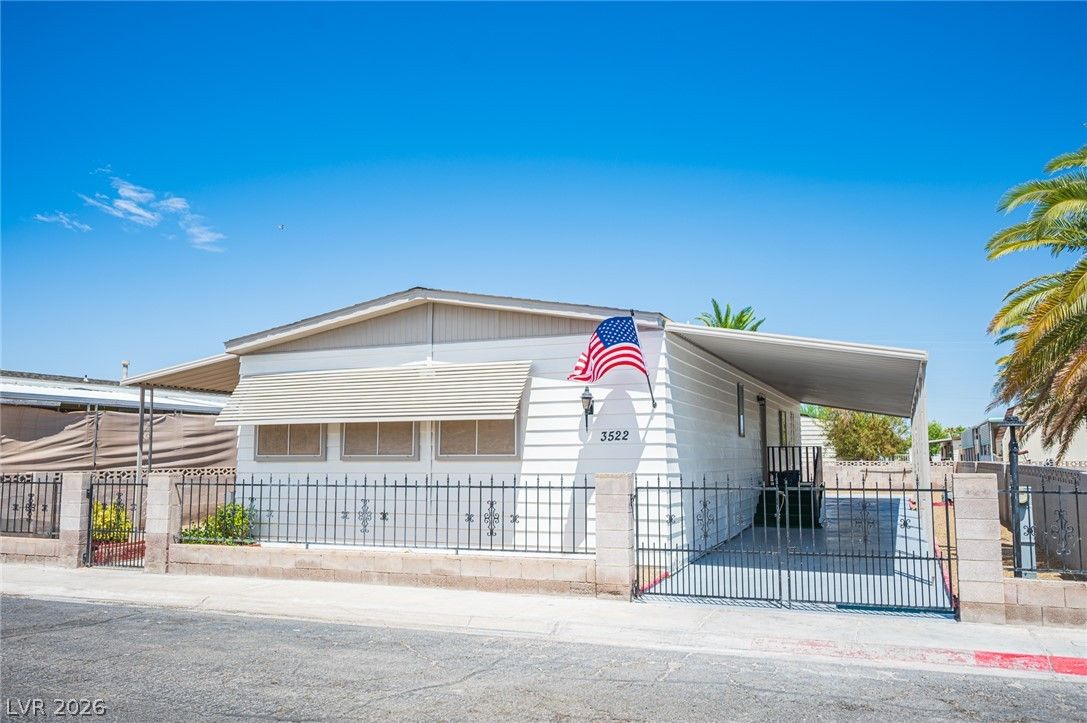
$274,0003 bd3 ba1,552 sqft$177/sqft0.20 mi37 daysSold 2026-08-07
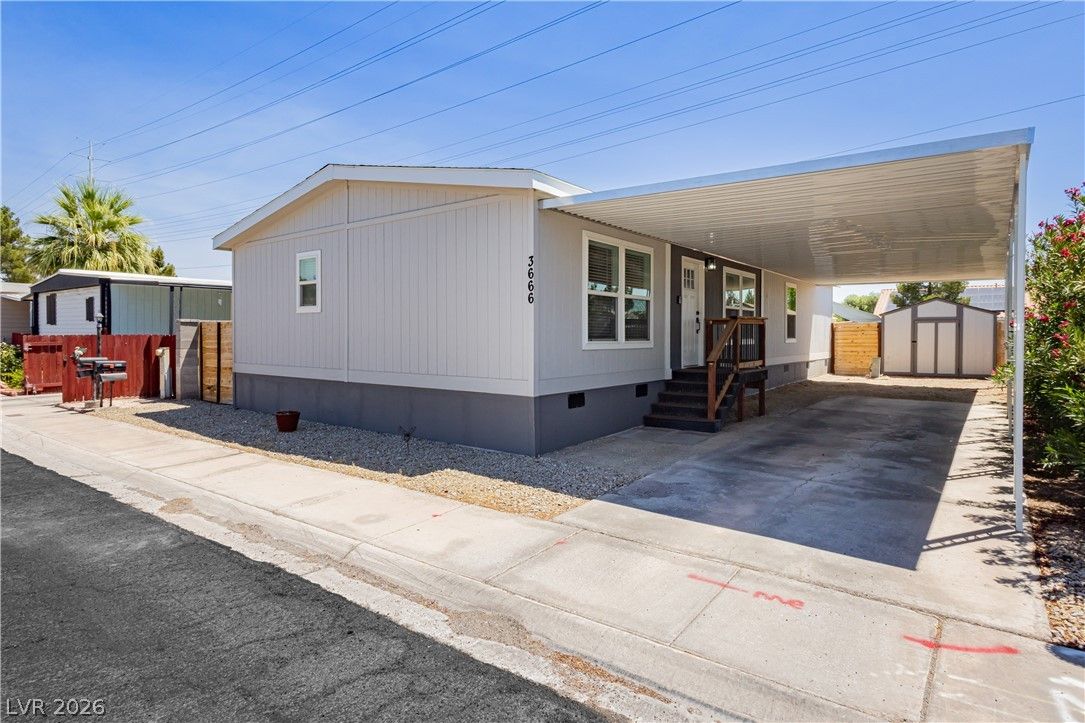
3666 Lost Hills DriveActive
$299,0003 bd2 ba1,512 sqft$198/sqft0.21 mi76 days
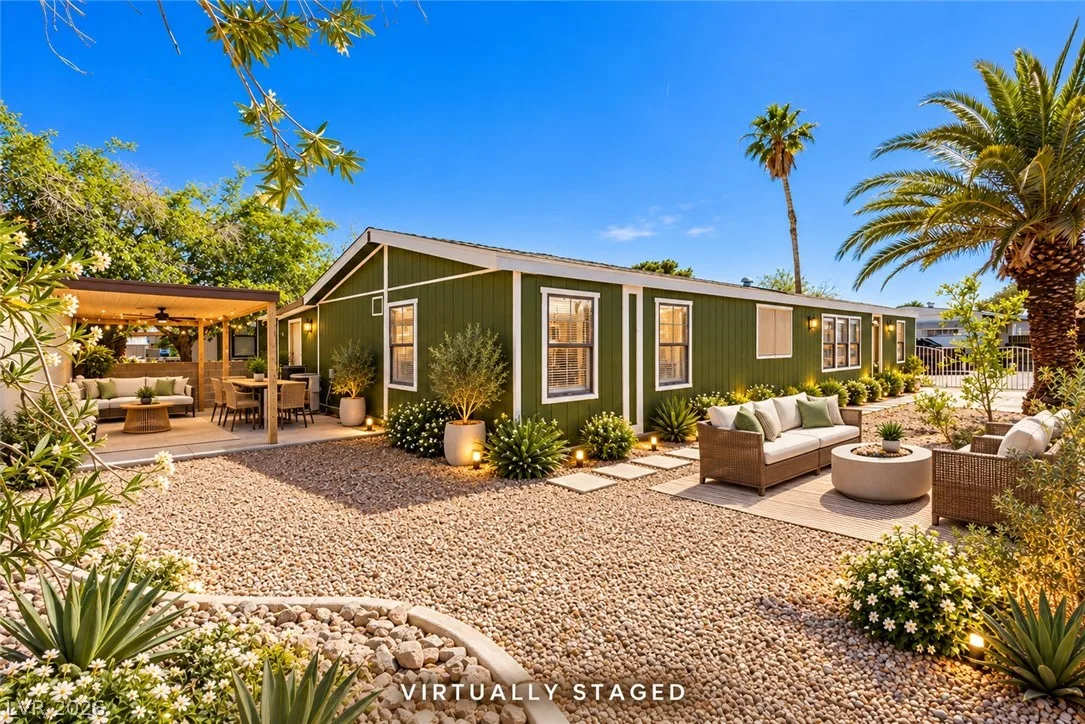
3608 Big Sur DriveActive
$288,0003 bd2 ba1,504 sqft$191/sqft0.22 mi0 days
$290,0003 bd2 ba1,344 sqft$216/sqft0.22 mi10 daysSold 2026-05-29
$240,0003 bd2 ba1,344 sqft$179/sqft0.22 mi8 daysSold 2026-06-16
Nearest comparable sales and listings
12 comparables · median price $272,000 · range $189,500 – $299,000 · median $/sq ft $179 · average $/sq ft $177
| Address | Status | Price | $/Sq Ft | Bd / Ba | Sq Ft | Sold / market time | Distance |
|---|---|---|---|---|---|---|---|
| 3670 Isle Royale Drive | Sold | $270,000 | $142 | 3 / 2 | 1,904 | Sold 2026-05-18 | 0.08 mi |
| 3615 Jewel Cave Drive | Sold | $265,000 | $194 | 3 / 2 | 1,368 | Sold 2026-05-22 | 0.13 mi |
| 3659 Death Valley Drive | Active | $240,000 | $179 | 3 / 2 | 1,344 | 17 days on market | 0.14 mi |
| 3619 Katmai Drive | Active | $189,500 | $141 | 2 / 2 | 1,344 | 95 days on market | 0.16 mi |
| 3560 Estes Park Drive | Active | $289,900 | $211 | 3 / 2 | 1,377 | 0 days on market | 0.17 mi |
| 3522 Isle Royale Drive | Sold | $274,000 | $177 | 3 / 3 | 1,552 | Sold 2026-08-07 | 0.20 mi |
| 3666 Lost Hills Drive | Active | $299,000 | $198 | 3 / 2 | 1,512 | 76 days on market | 0.21 mi |
| 3608 Big Sur Drive | Active | $288,000 | $191 | 3 / 2 | 1,504 | 0 days on market | 0.22 mi |
| 3651 Big Sur Drive | Sold | $290,000 | $216 | 3 / 2 | 1,344 | Sold 2026-05-29 | 0.22 mi |
| 3529 Death Valley Drive | Sold | $240,000 | $179 | 3 / 2 | 1,344 | Sold 2026-06-16 | 0.22 mi |
| 3559 Lost Hills Drive | Active | $274,900 | $168 | 3 / 2 | 1,632 | 0 days on market | 0.23 mi |
| 3519 Katmai Drive | Pending | $239,000 | $132 | 3 / 2 | 1,810 | 15 days on market | 0.23 mi |


