
Comparable Sales Near 4848 Englewood Avenue, Las Vegas, NV 89139
1st Realty · Comparable sales report · 1st.estate · October 21, 2026
Read the Enterprise neighborhood guide →
4848 Englewood Avenue, Las Vegas, NV 89139
Status: Sold
$1,750 Sold Price
$1
$ / Sq Ft
1,462
Living Area
3,485 sqft
Lot Size
3
Beds
3
Baths
2002
Year Built
Search Parameters
Property Type
Status
Radius
Sold Within
Beds
Baths
Living Area (Sq Ft)
Lot Size (Sq Ft)
This comp search reflects your current search parameters — adjust the filters above as needed for a more accurate estimate.
Estimated Value
—
Average $/Sqft
—
Check one or more comps below to calculate an estimate.
Nearest 10 of 50 comparable sales and listings within 1 mile of this home. Use the filters above and press Search to refine.
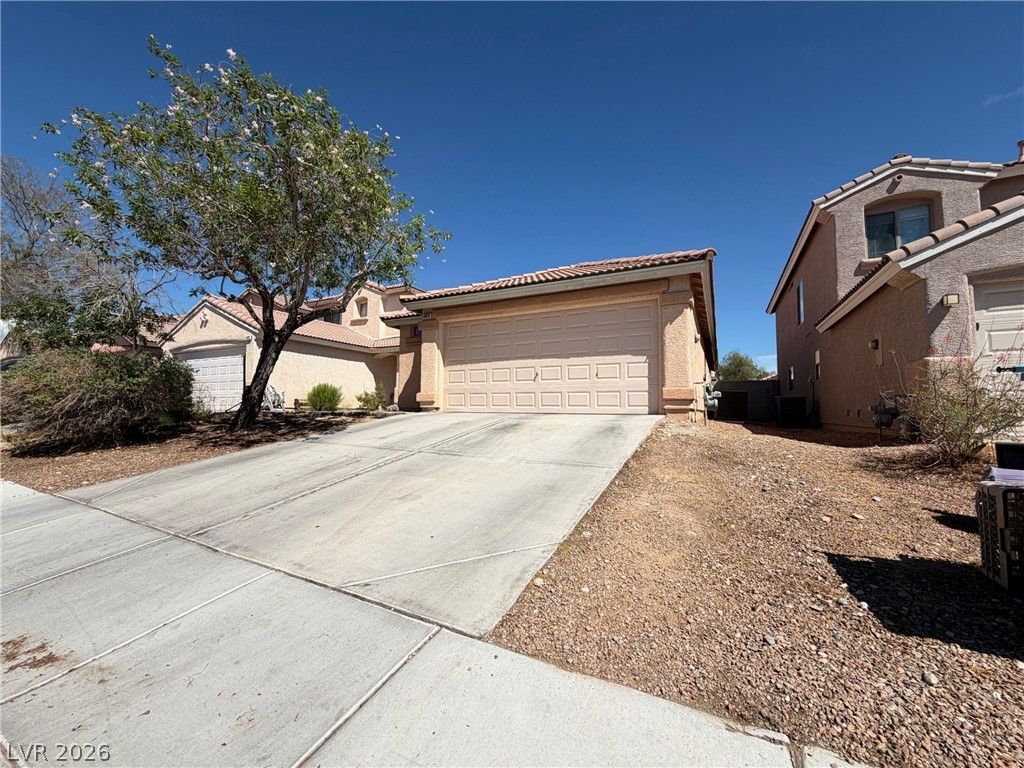
4818 Lone Grove DriveActive
$375,0003 bd2 ba1,108 sqft$338/sqft0.05 mi47 days
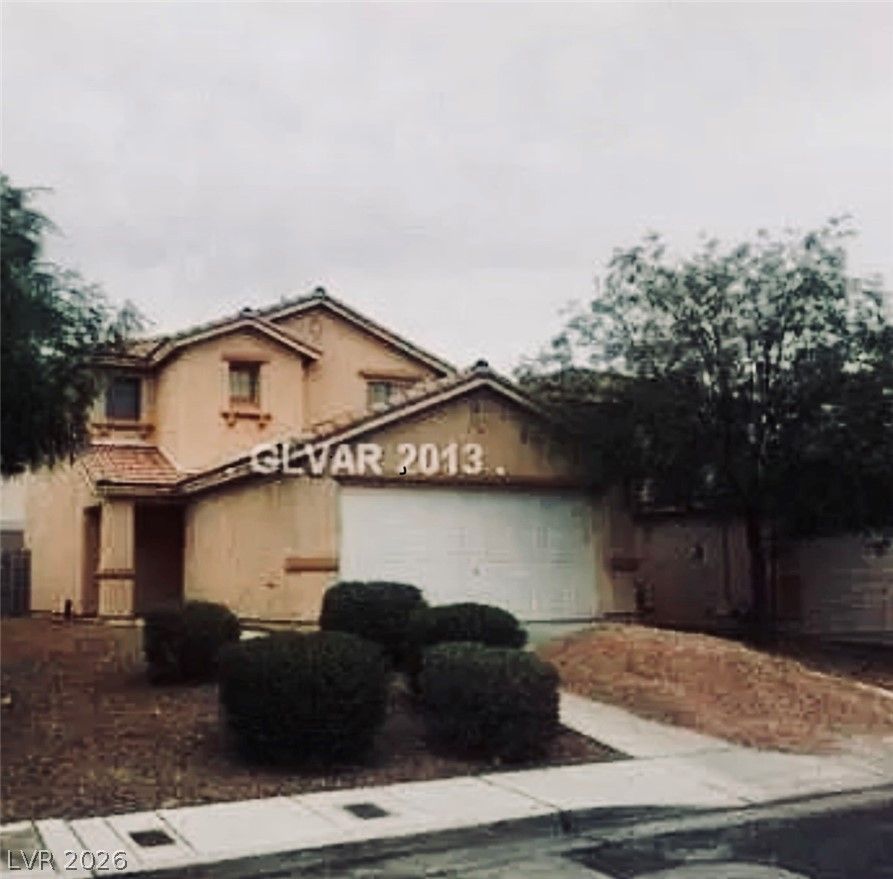
4732 Lone Grove DriveActive
$434,9003 bd3 ba1,462 sqft$297/sqft0.10 mi0 days
$406,0003 bd3 ba1,758 sqft$231/sqft0.21 mi7 daysSold 2026-05-29
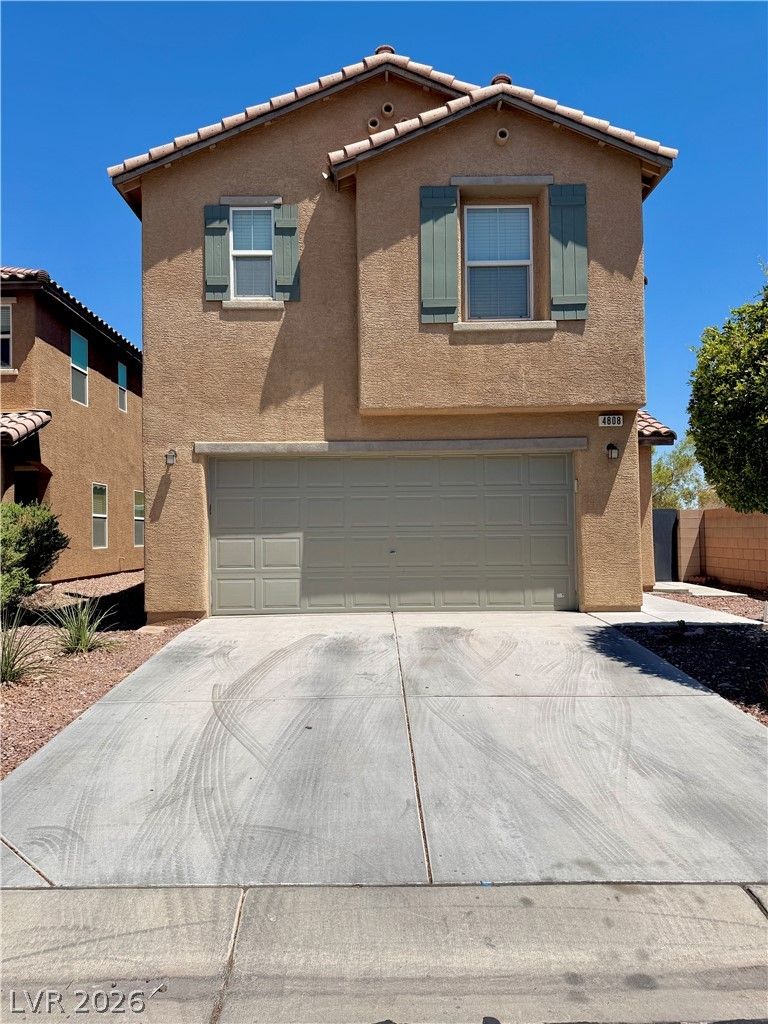
$420,0003 bd3 ba1,657 sqft$253/sqft0.24 mi48 daysSold 2026-09-28
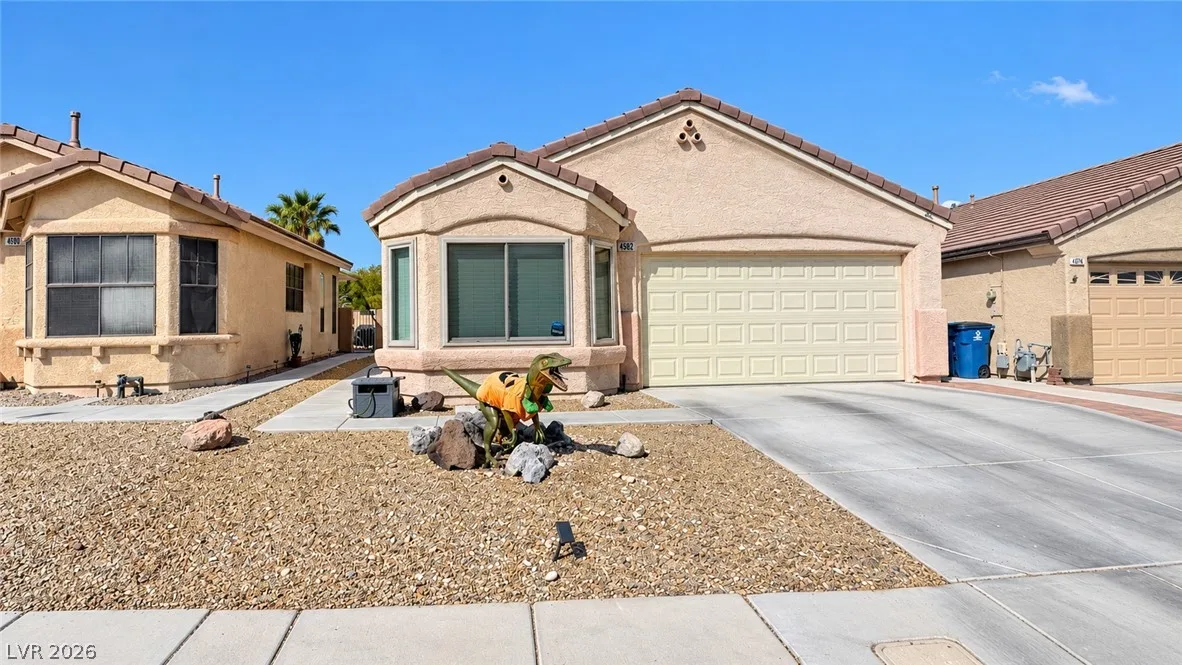
4582 Ordway DriveActive
$380,0003 bd2 ba1,452 sqft$262/sqft0.28 mi5 days
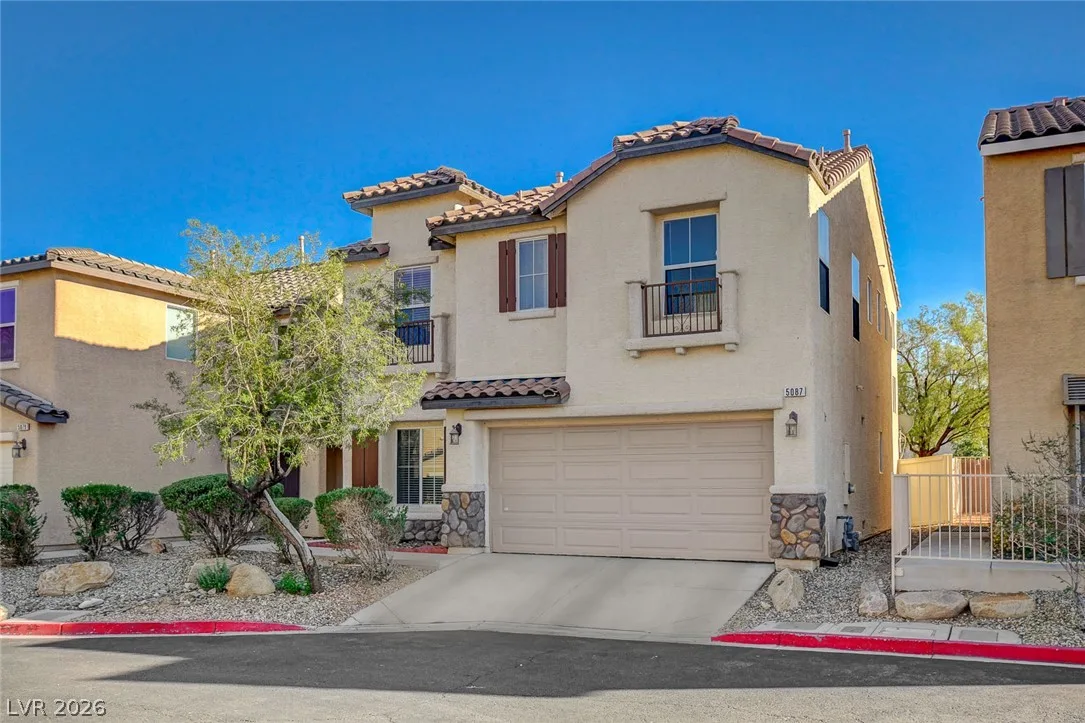
5087 Penryn CourtActive
$435,0003 bd3 ba1,366 sqft$318/sqft0.34 mi1 days
$373,0003 bd2 ba1,208 sqft$309/sqft0.36 mi65 daysSold 2026-06-23
$310,0003 bd3 ba1,270 sqft$244/sqft0.44 mi6 daysSold 2026-06-26
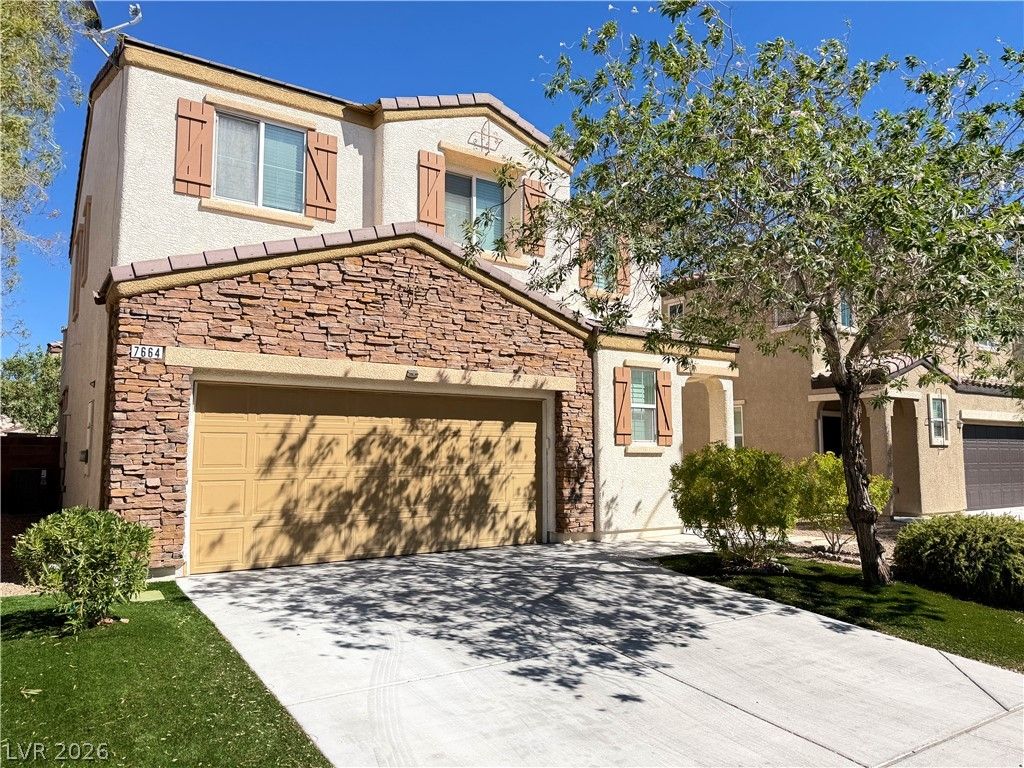
$415,0003 bd3 ba1,655 sqft$251/sqft0.45 mi5 daysSold 2026-09-29
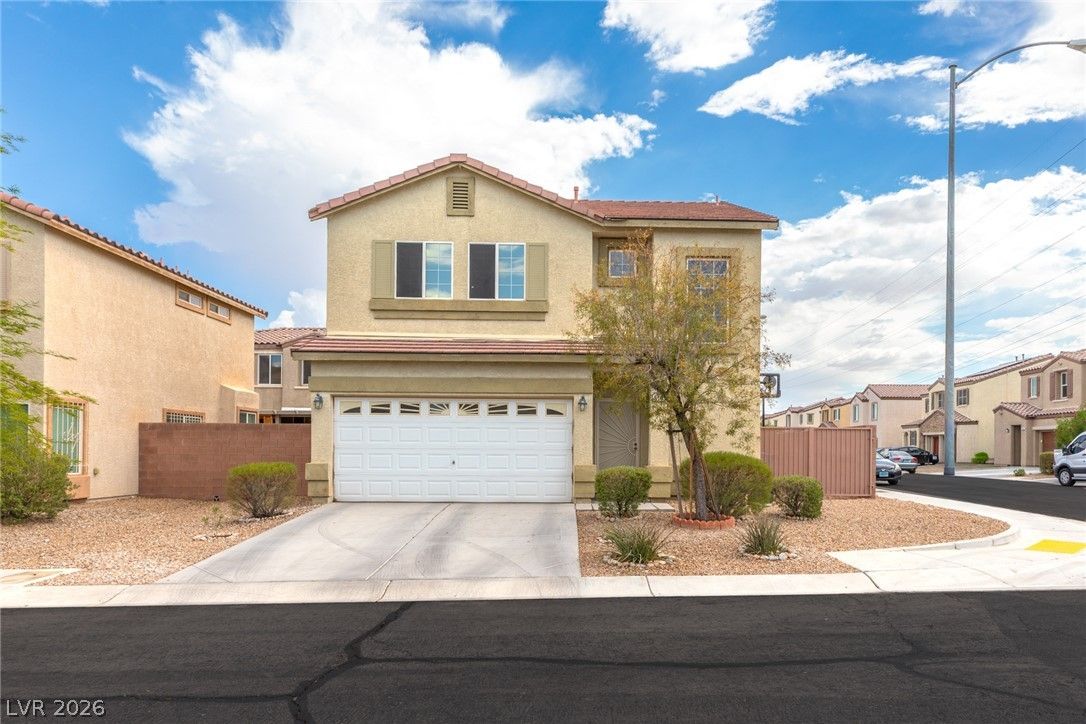
5181 Gilleran AvenuePending
$410,0003 bd3 ba1,600 sqft$256/sqft0.51 mi60 days
Nearest comparable sales and listings
12 comparables · median price $407,950 · range $310,000 – $435,000 · median $/sq ft $256 · average $/sq ft $273
| Address | Status | Price | $/Sq Ft | Bd / Ba | Sq Ft | Sold / market time | Distance |
|---|---|---|---|---|---|---|---|
| 4818 Lone Grove Drive | Active | $375,000 | $338 | 3 / 2 | 1,108 | 47 days on market | 0.05 mi |
| 4732 Lone Grove Drive | Active | $434,900 | $297 | 3 / 3 | 1,462 | 0 days on market | 0.10 mi |
| 5078 Tioga Pass Avenue | Sold | $406,000 | $231 | 3 / 3 | 1,758 | Sold 2026-05-29 | 0.21 mi |
| 4808 Diamond Estates Court | Sold | $420,000 | $253 | 3 / 3 | 1,657 | Sold 2026-09-28 | 0.24 mi |
| 4582 Ordway Drive | Active | $380,000 | $262 | 3 / 2 | 1,452 | 5 days on market | 0.28 mi |
| 5087 Penryn Court | Active | $435,000 | $318 | 3 / 3 | 1,366 | 1 days on market | 0.34 mi |
| 7882 Snow Angel Street | Sold | $373,000 | $309 | 3 / 2 | 1,208 | Sold 2026-06-23 | 0.36 mi |
| 8330 Bismark Sapphire Street | Sold | $310,000 | $244 | 3 / 3 | 1,270 | Sold 2026-06-26 | 0.44 mi |
| 7664 Black River Street | Sold | $415,000 | $251 | 3 / 3 | 1,655 | Sold 2026-09-29 | 0.45 mi |
| 5181 Gilleran Avenue | Pending | $410,000 | $256 | 3 / 3 | 1,600 | 60 days on market | 0.51 mi |
| 5158 Gilleran Avenue | Active | $409,900 | $256 | 3 / 3 | 1,600 | 20 days on market | 0.52 mi |
| 7580 Thistle Poppy Street | Sold | $405,000 | $256 | 4 / 3 | 1,584 | Sold 2026-05-21 | 0.57 mi |


