
Comparable Sales Near 7936 Windhamridge Drive, Las Vegas, NV 89139
1st Realty · Comparable sales report · 1st.estate · October 21, 2026
Read the Enterprise neighborhood guide →
7936 Windhamridge Drive, Las Vegas, NV 89139
Status: Sold
$1,850 Sold Price
$1
$ / Sq Ft
1,398
Living Area
3,485 sqft
Lot Size
3
Beds
3
Baths
2003
Year Built
Search Parameters
Property Type
Status
Radius
Sold Within
Beds
Baths
Living Area (Sq Ft)
Lot Size (Sq Ft)
This comp search reflects your current search parameters — adjust the filters above as needed for a more accurate estimate.
Estimated Value
—
Average $/Sqft
—
Check one or more comps below to calculate an estimate.
Nearest 10 of 50 comparable sales and listings within 1 mile of this home. Use the filters above and press Search to refine.
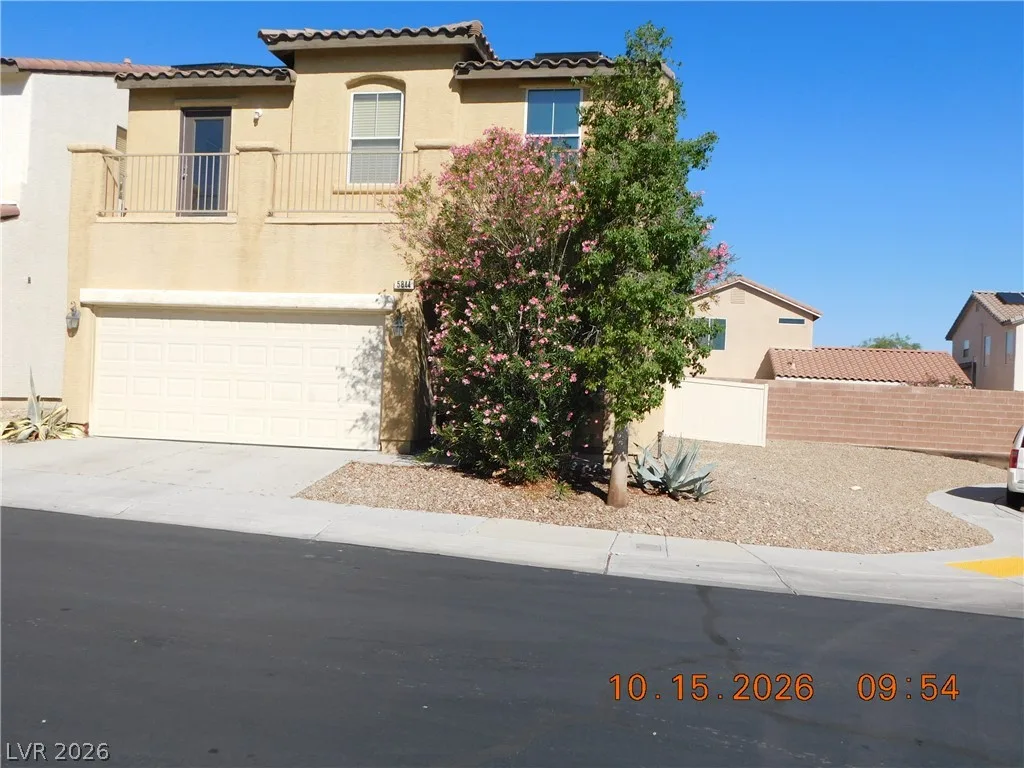
5844 Parrot Cove CourtActive
$415,7504 bd3 ba1,746 sqft$238/sqft0.04 mi2 days
$369,9003 bd3 ba1,476 sqft$251/sqft0.04 mi121 daysSold 2026-05-08
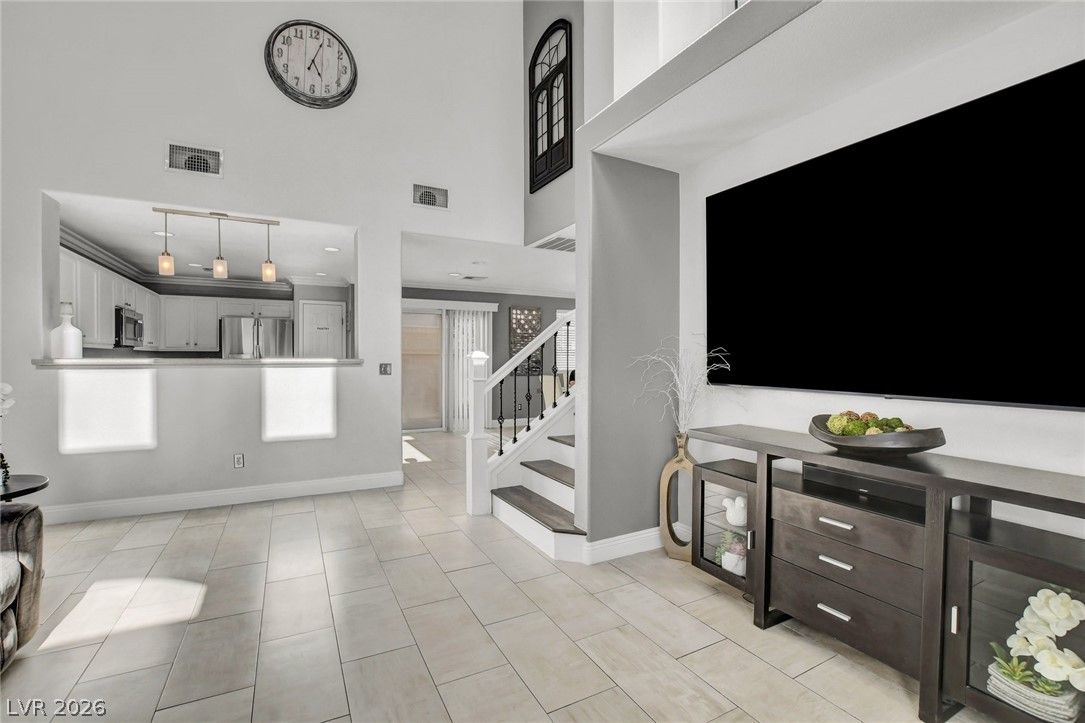
$400,0003 bd3 ba1,650 sqft$242/sqft0.08 mi6 daysSold 2026-09-30
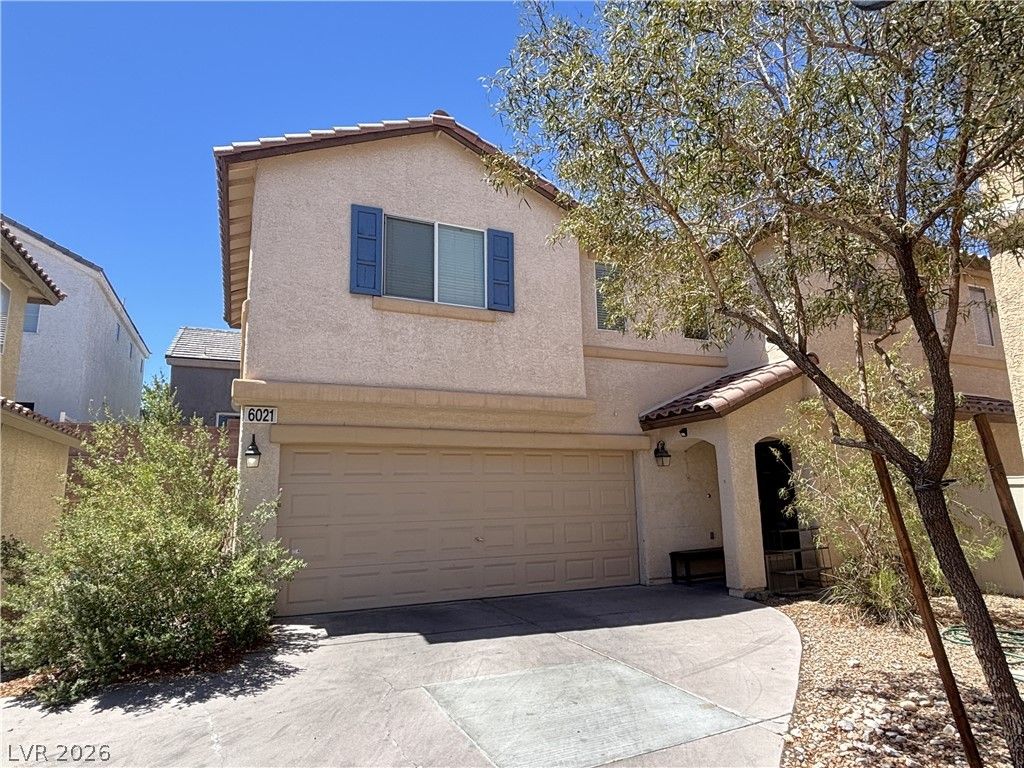
6021 Banbury Heights WayActive
$349,9003 bd3 ba1,398 sqft$250/sqft0.12 mi74 days
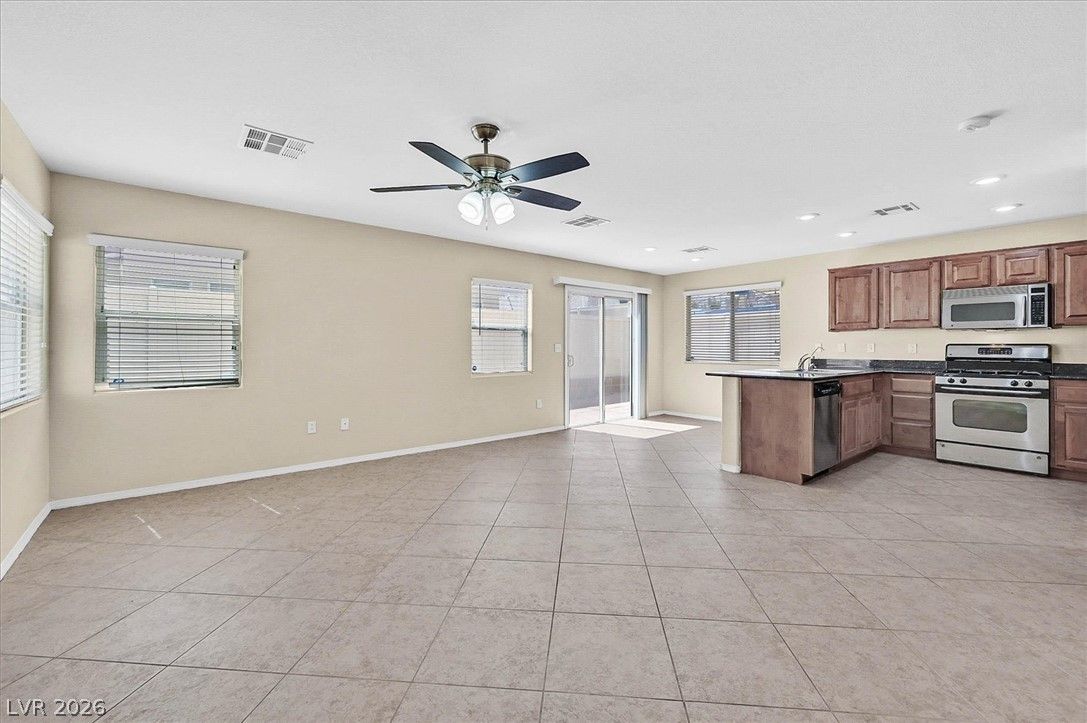
$350,0003 bd3 ba1,358 sqft$258/sqft0.29 mi78 daysSold 2026-10-01
$380,0003 bd3 ba1,363 sqft$279/sqft0.33 mi28 daysSold 2026-05-07
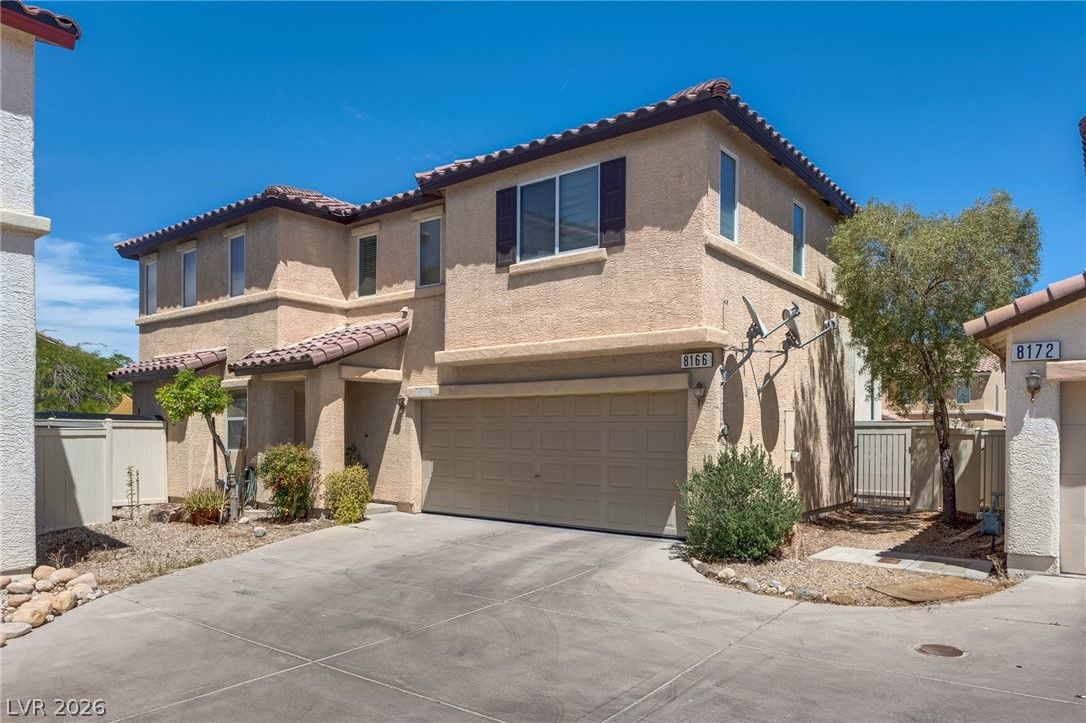
$350,0003 bd3 ba1,398 sqft$250/sqft0.33 mi104 daysSold 2026-09-03
$411,5003 bd3 ba1,527 sqft$269/sqft0.34 mi13 daysSold 2026-06-18
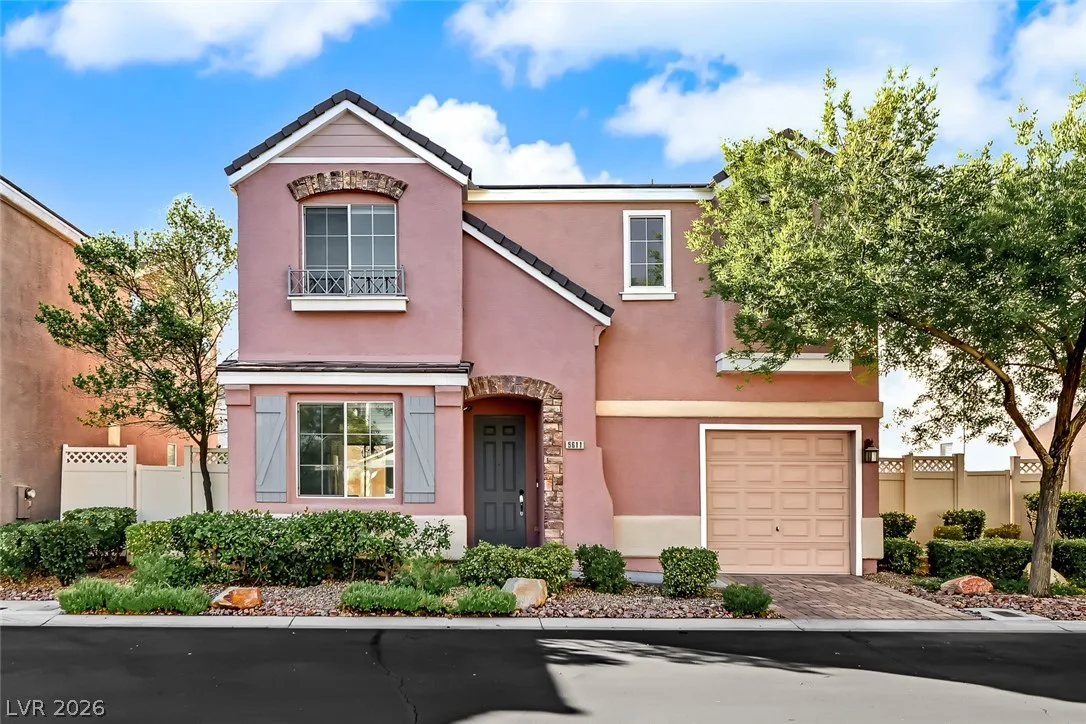
5611 Aurora Crest AvenueActive
$389,9003 bd3 ba1,406 sqft$277/sqft0.38 mi3 days
$410,0003 bd3 ba1,669 sqft$246/sqft0.40 mi4 daysSold 2026-06-30
Nearest comparable sales and listings
12 comparables · median price $382,500 · range $349,900 – $415,750 · median $/sq ft $254 · average $/sq ft $259
| Address | Status | Price | $/Sq Ft | Bd / Ba | Sq Ft | Sold / market time | Distance |
|---|---|---|---|---|---|---|---|
| 5844 Parrot Cove Court | Active | $415,750 | $238 | 4 / 3 | 1,746 | 2 days on market | 0.04 mi |
| 5934 Banbury Heights Way | Sold | $369,900 | $251 | 3 / 3 | 1,476 | Sold 2026-05-08 | 0.04 mi |
| 5974 Banbury Heights Way | Sold | $400,000 | $242 | 3 / 3 | 1,650 | Sold 2026-09-30 | 0.08 mi |
| 6021 Banbury Heights Way | Active | $349,900 | $250 | 3 / 3 | 1,398 | 74 days on market | 0.12 mi |
| 5732 Rose Tiara Drive | Sold | $350,000 | $258 | 3 / 3 | 1,358 | Sold 2026-10-01 | 0.29 mi |
| 7832 Soda Canyon Street | Sold | $380,000 | $279 | 3 / 3 | 1,363 | Sold 2026-05-07 | 0.33 mi |
| 8166 Royal Lilly Court | Sold | $350,000 | $250 | 3 / 3 | 1,398 | Sold 2026-09-03 | 0.33 mi |
| 8086 Flower Festival Street | Sold | $411,500 | $269 | 3 / 3 | 1,527 | Sold 2026-06-18 | 0.34 mi |
| 5611 Aurora Crest Avenue | Active | $389,900 | $277 | 3 / 3 | 1,406 | 3 days on market | 0.38 mi |
| 7630 Glorietta Bay Court | Sold | $410,000 | $246 | 3 / 3 | 1,669 | Sold 2026-06-30 | 0.40 mi |
| 8220 Royal Lilly Court | Sold | $370,000 | $272 | 3 / 3 | 1,358 | Sold 2026-10-01 | 0.40 mi |
| 5862 Baroque Gold Court | Sold | $385,000 | $275 | 3 / 3 | 1,398 | Sold 2026-06-16 | 0.41 mi |


