
Comparable Sales Near 523 Park Royal Drive, North Las Vegas, NV 89031
1st Realty · Comparable sales report · 1st.estate · October 20, 2026
Read the North Las Vegas area guide →
523 Park Royal Drive, North Las Vegas, NV 89031
Status: Sold
$435,000 Sold Price
$250
$ / Sq Ft
1,741
Living Area
9,148 sqft
Lot Size
3
Beds
2
Baths
2007
Year Built
Search Parameters
Property Type
Status
Radius
Sold Within
Beds
Baths
Living Area (Sq Ft)
Lot Size (Sq Ft)
This comp search reflects your current search parameters — adjust the filters above as needed for a more accurate estimate.
Estimated Value
—
Average $/Sqft
—
Check one or more comps below to calculate an estimate.
Nearest 10 of 21 comparable sales and listings within 1 mile of this home. Use the filters above and press Search to refine.
$467,0003 bd3 ba2,162 sqft$216/sqft0.07 mi93 daysSold 2026-05-11
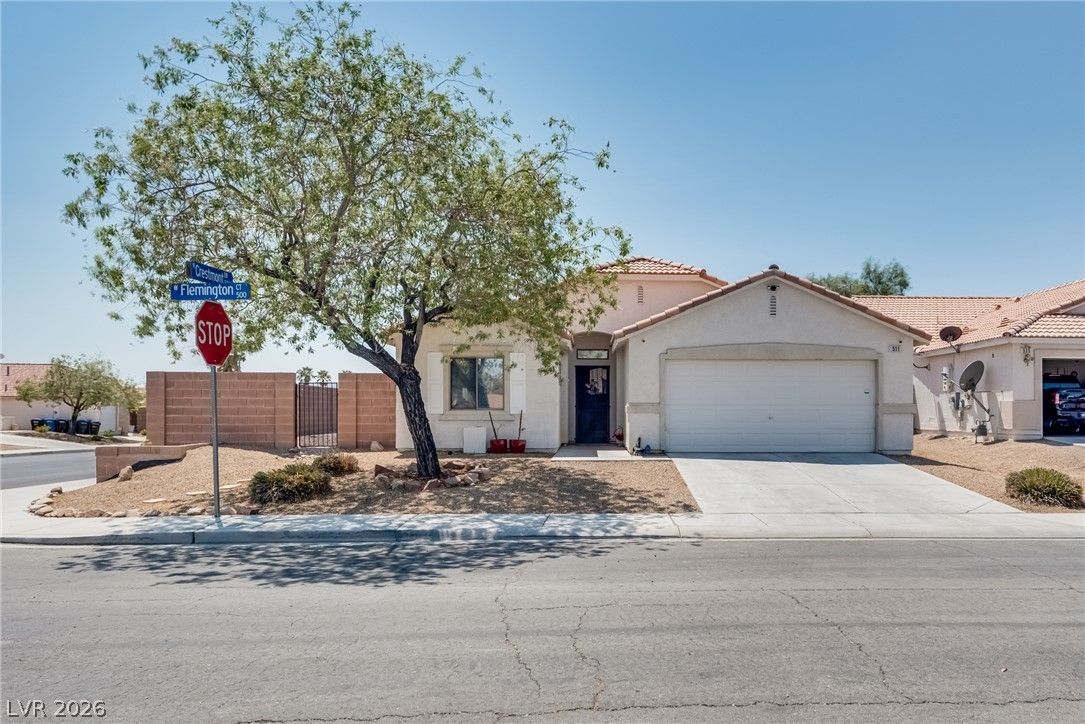
511 Flemington CourtPending
$420,0003 bd2 ba1,622 sqft$259/sqft0.37 mi59 days
$419,9004 bd2 ba1,825 sqft$230/sqft0.38 mi2 daysSold 2026-06-04
628 Tonin AvenueSold
$407,0003 bd2 ba1,690 sqft$241/sqft0.49 mi30 daysSold 2026-06-15
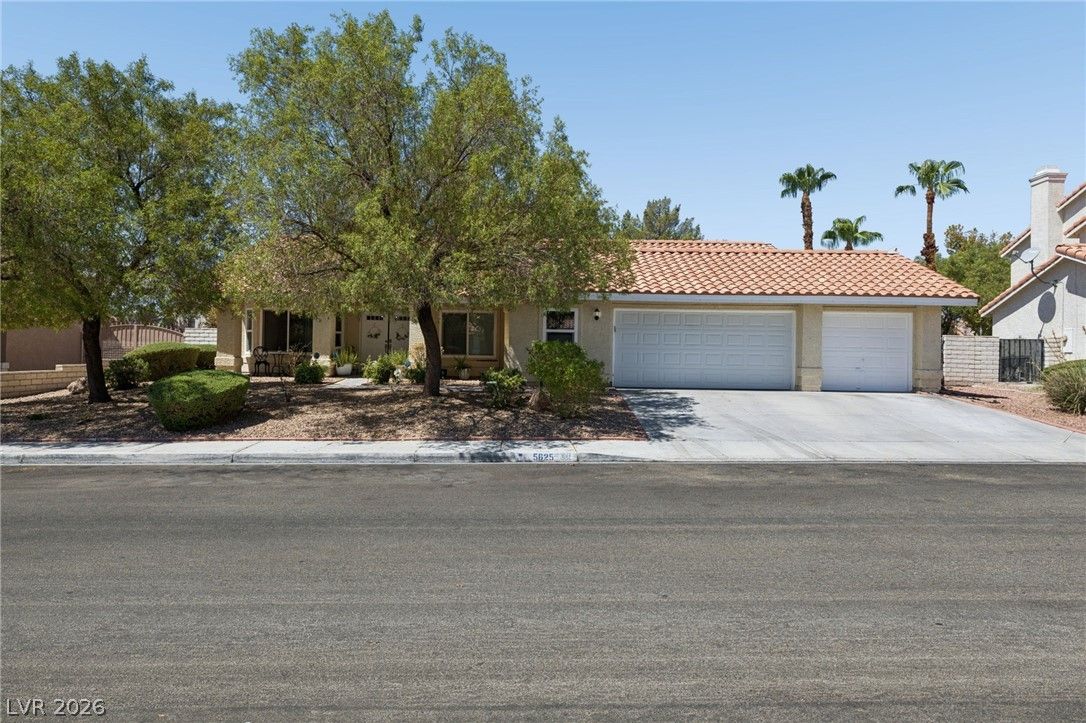
$475,0003 bd2 ba1,915 sqft$248/sqft0.51 mi10 daysSold 2026-09-29
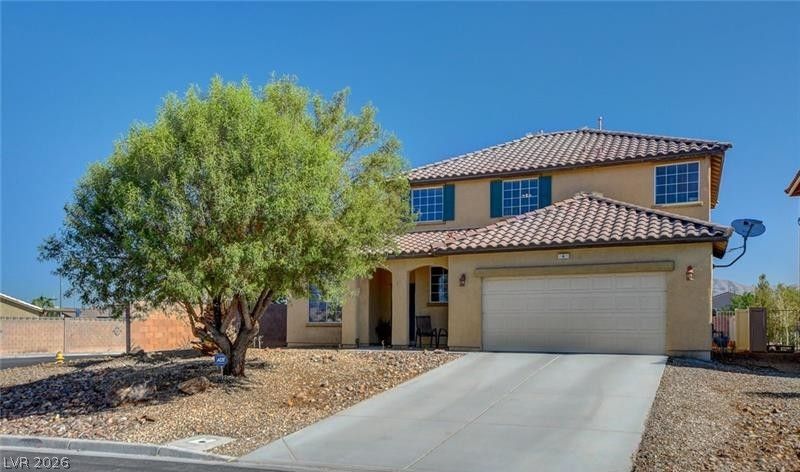
4 Goldleaf Falls AvenueActive
$465,0004 bd3 ba1,943 sqft$239/sqft0.52 mi15 days
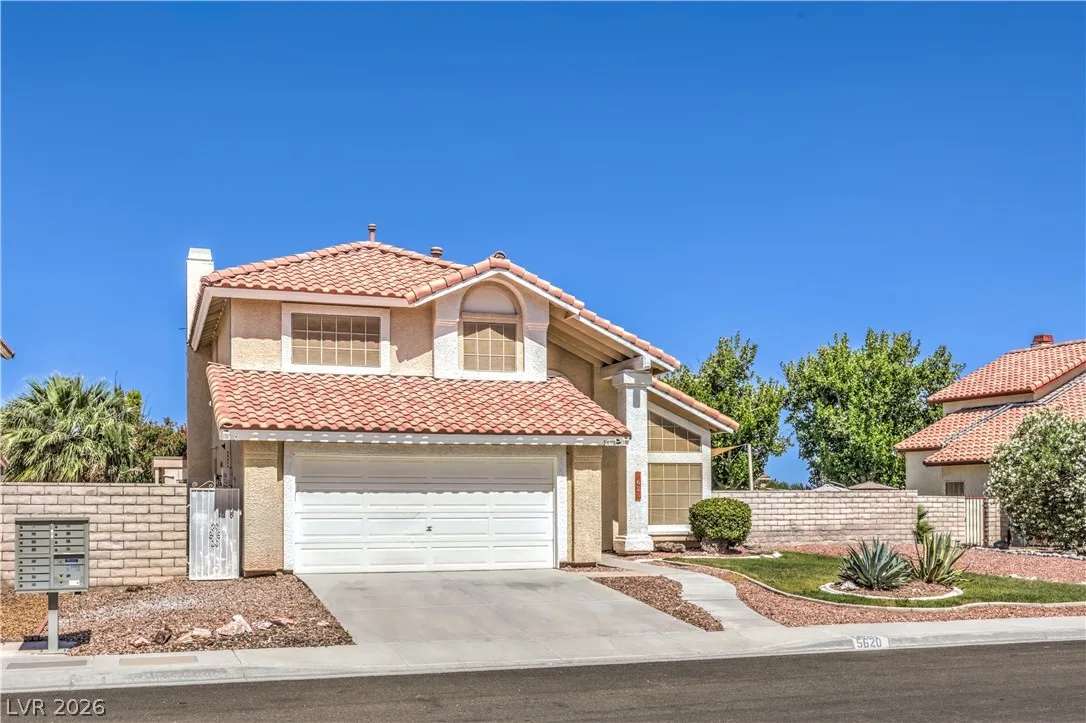
5620 Indian Ridge DriveActive
$450,0003 bd3 ba1,799 sqft$250/sqft0.55 mi1 days
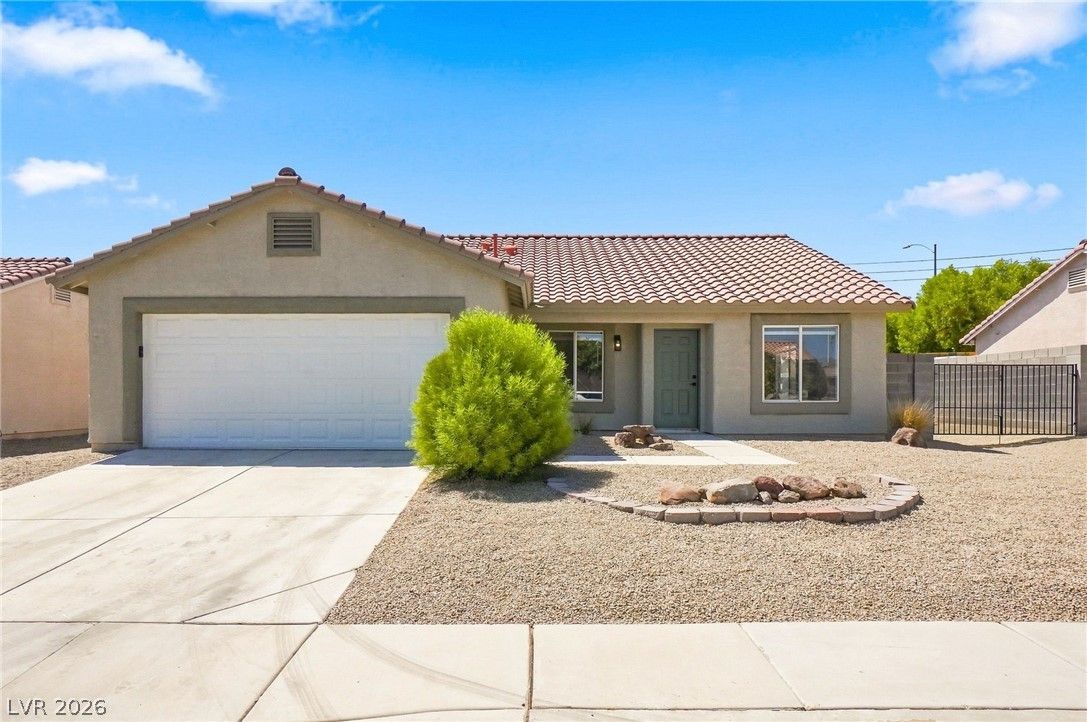
$419,0003 bd2 ba1,546 sqft$271/sqft0.59 mi11 daysSold 2026-09-21
$415,0003 bd2 ba1,483 sqft$280/sqft0.60 mi21 daysSold 2026-07-10
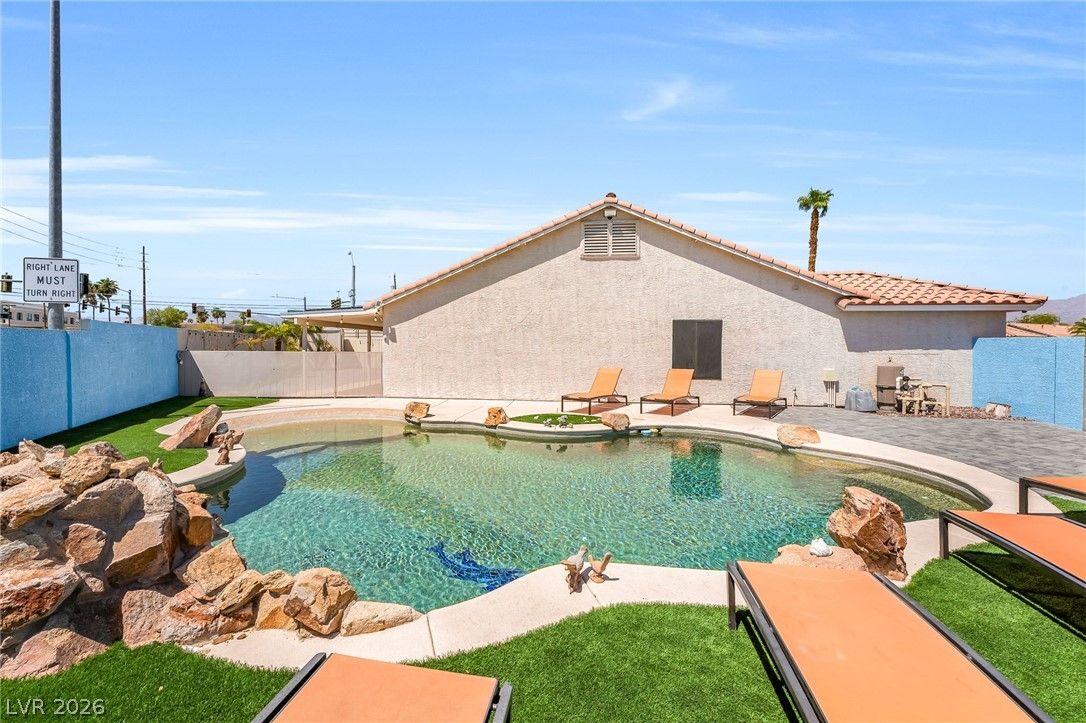
719 Carlitos AvenueUnder Contract
$485,0003 bd2 ba1,639 sqft$296/sqft0.63 mi40 days
Nearest comparable sales and listings
12 comparables · median price $430,000 · range $406,000 – $485,000 · median $/sq ft $248 · average $/sq ft $252
| Address | Status | Price | $/Sq Ft | Bd / Ba | Sq Ft | Sold / market time | Distance |
|---|---|---|---|---|---|---|---|
| 5728 Copper Sun Court | Sold | $467,000 | $216 | 3 / 3 | 2,162 | Sold 2026-05-11 | 0.07 mi |
| 511 Flemington Court | Pending | $420,000 | $259 | 3 / 2 | 1,622 | 59 days on market | 0.37 mi |
| 5932 Crestmont Drive | Sold | $419,900 | $230 | 4 / 2 | 1,825 | Sold 2026-06-04 | 0.38 mi |
| 628 Tonin Avenue | Sold | $407,000 | $241 | 3 / 2 | 1,690 | Sold 2026-06-15 | 0.49 mi |
| 5625 Clay Ridge Road | Sold | $475,000 | $248 | 3 / 2 | 1,915 | Sold 2026-09-29 | 0.51 mi |
| 4 Goldleaf Falls Avenue | Active | $465,000 | $239 | 4 / 3 | 1,943 | 15 days on market | 0.52 mi |
| 5620 Indian Ridge Drive | Active | $450,000 | $250 | 3 / 3 | 1,799 | 1 days on market | 0.55 mi |
| 601 Carlitos Avenue | Sold | $419,000 | $271 | 3 / 2 | 1,546 | Sold 2026-09-21 | 0.59 mi |
| 5218 Sangara Drive | Sold | $415,000 | $280 | 3 / 2 | 1,483 | Sold 2026-07-10 | 0.60 mi |
| 719 Carlitos Avenue | Under Contract | $485,000 | $296 | 3 / 2 | 1,639 | 40 days on market | 0.63 mi |
| 5211 Joshua Jose Street | Sold | $406,000 | $248 | 3 / 2 | 1,639 | Sold 2026-10-13 | 0.63 mi |
| 306 Violetta Avenue | Sold | $440,000 | $245 | 4 / 2 | 1,797 | Sold 2026-06-03 | 0.66 mi |


