
Comparable Sales Near 5180 Los Pinos Street, Las Vegas, NV 89122
1st Realty · Comparable sales report · 1st.estate · October 20, 2026
Browse our Las Vegas area guides →
5180 Los Pinos Street, Las Vegas, NV 89122
Status: Sold
$299,000 Sold Price
$243
$ / Sq Ft
1,232
Living Area
6,534 sqft
Lot Size
3
Beds
2
Baths
1997
Year Built
Search Parameters
Property Type
Status
Radius
Sold Within
Beds
Baths
Living Area (Sq Ft)
Lot Size (Sq Ft)
This comp search reflects your current search parameters — adjust the filters above as needed for a more accurate estimate.
Estimated Value
—
Average $/Sqft
—
Check one or more comps below to calculate an estimate.
Nearest 9 of 9 comparable sales and listings within 1 mile of this home. Use the filters above and press Search to refine.

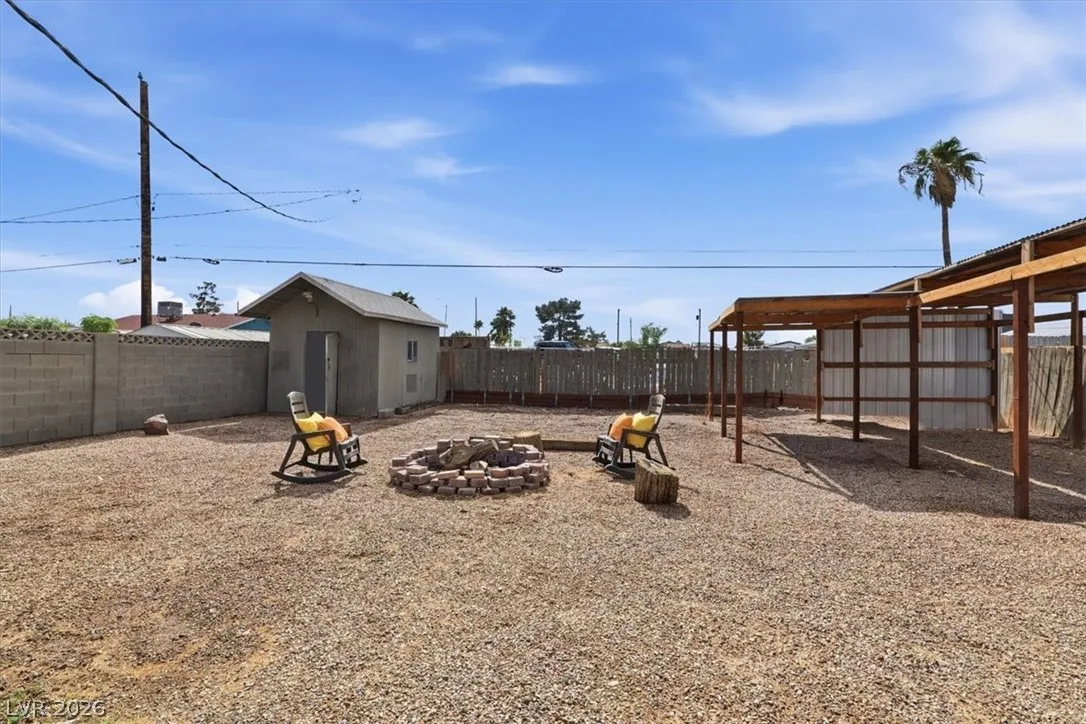
5206 Nevada AvenueActive
$349,9953 bd3 ba1,431 sqft$245/sqft0.34 mi0 days
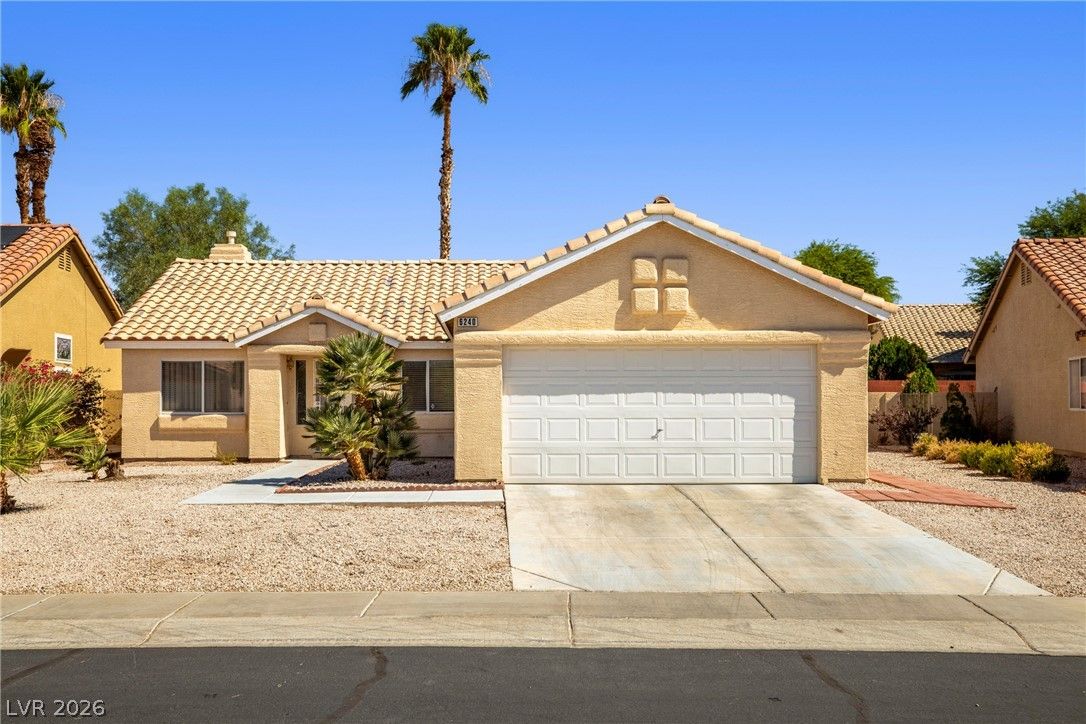
5875 Bunch StreetActive
$300,0003 bd1 ba960 sqft$313/sqft0.51 mi0 days
$355,0004 bd2 ba1,324 sqft$268/sqft0.75 mi27 daysSold 2026-08-27

$349,9004 bd3 ba1,364 sqft$257/sqft0.76 mi90 daysSold 2026-10-09
$232,0002 bd2 ba1,047 sqft$222/sqft0.86 mi40 daysSold 2026-05-29
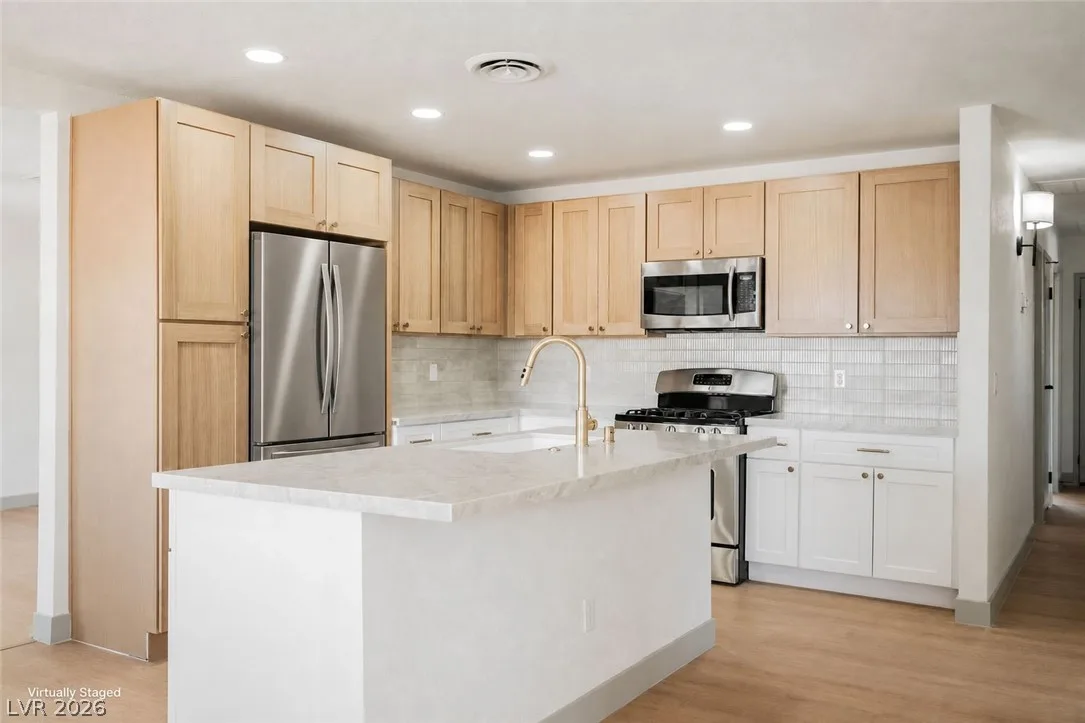
5637 Tunis AvenueActive
$369,9954 bd2 ba1,420 sqft$261/sqft0.94 mi2 days
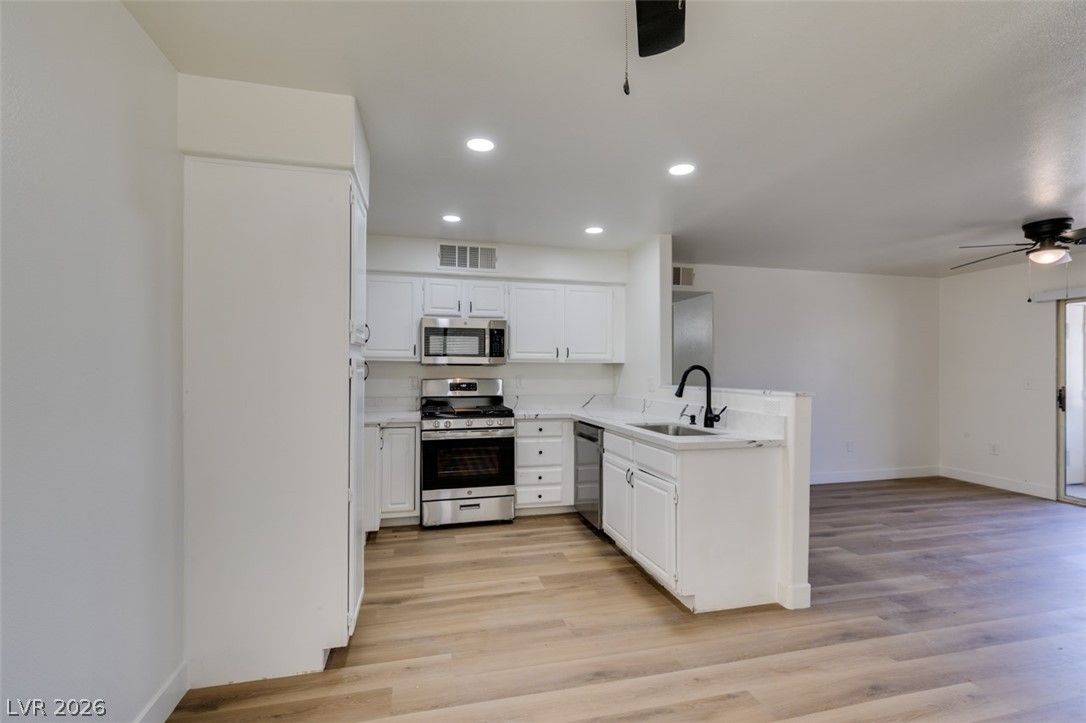
$210,0002 bd2 ba1,029 sqft$204/sqft0.95 mi92 days
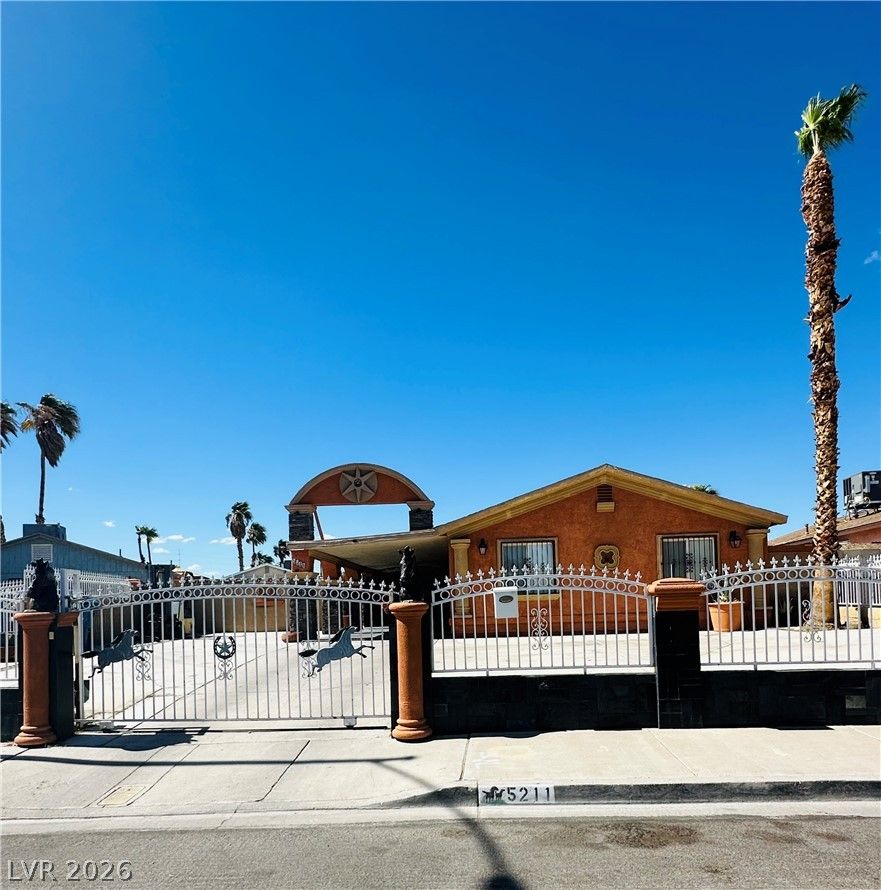
5211 Gloucester CirclePending
$379,9904 bd2 ba1,200 sqft$317/sqft0.98 mi12 days
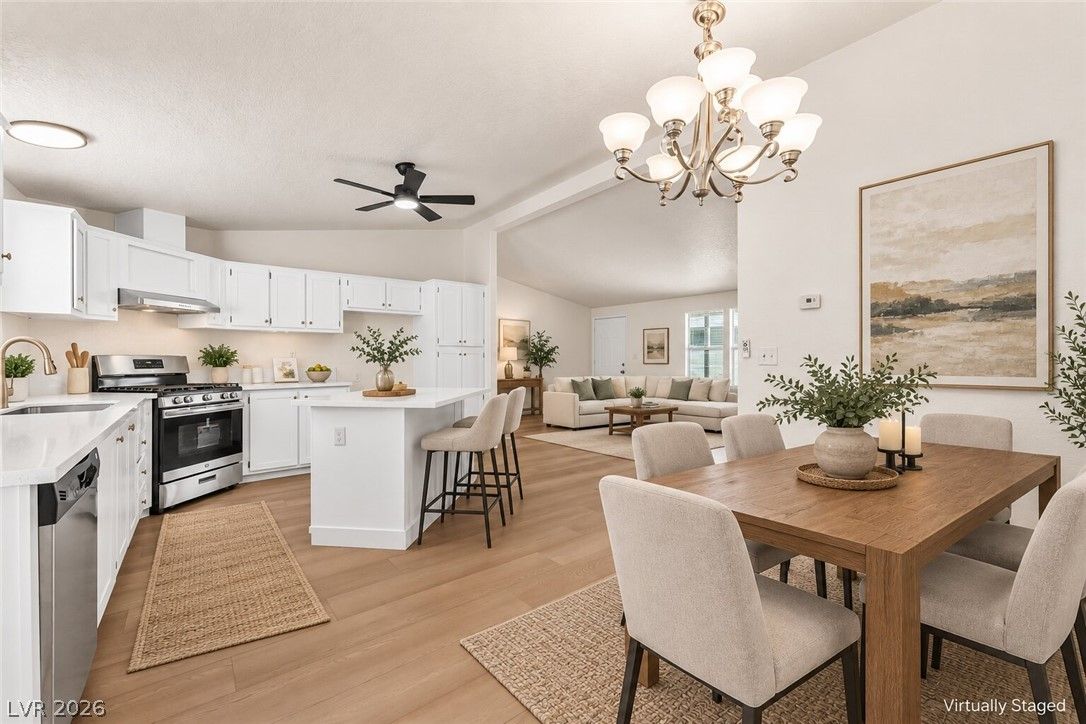
5962 Sassy Rose DrivePending
$269,8883 bd2 ba1,188 sqft$227/sqft0.99 mi6 days
Nearest comparable sales and listings
9 comparables · median price $349,900 · range $210,000 – $379,990 · median $/sq ft $257 · average $/sq ft $257
| Address | Status | Price | $/Sq Ft | Bd / Ba | Sq Ft | Sold / market time | Distance |
|---|---|---|---|---|---|---|---|
| 5206 Nevada Avenue | Active | $349,995 | $245 | 3 / 3 | 1,431 | 0 days on market | 0.34 mi |
| 5875 Bunch Street | Active | $300,000 | $313 | 3 / 1 | 960 | 0 days on market | 0.51 mi |
| 6240 Curlew Drive | Sold | $355,000 | $268 | 4 / 2 | 1,324 | Sold 2026-08-27 | 0.75 mi |
| 5856 Thurgood Avenue | Sold | $349,900 | $257 | 4 / 3 | 1,364 | Sold 2026-10-09 | 0.76 mi |
| 5710 East Tropicana Avenue 2022 | Sold | $232,000 | $222 | 2 / 2 | 1,047 | Sold 2026-05-29 | 0.86 mi |
| 5637 Tunis Avenue | Active | $369,995 | $261 | 4 / 2 | 1,420 | 2 days on market | 0.94 mi |
| 5710 East Tropicana Avenue 1225 | Active | $210,000 | $204 | 2 / 2 | 1,029 | 92 days on market | 0.95 mi |
| 5211 Gloucester Circle | Pending | $379,990 | $317 | 4 / 2 | 1,200 | 12 days on market | 0.98 mi |
| 5962 Sassy Rose Drive | Pending | $269,888 | $227 | 3 / 2 | 1,188 | 6 days on market | 0.99 mi |


