
Comparable Sales Near 9992 Oyster Pearl Street, Las Vegas, NV 89183
1st Realty · Comparable sales report · 1st.estate · October 21, 2026
Read the Silverado Ranch neighborhood guide →
9992 Oyster Pearl Street, Las Vegas, NV 89183
Status: Sold
$508,000 Sold Price
$270
$ / Sq Ft
1,881
Living Area
5,227 sqft
Lot Size
3
Beds
3
Baths
2000
Year Built
Search Parameters
Property Type
Status
Radius
Sold Within
Beds
Baths
Living Area (Sq Ft)
Lot Size (Sq Ft)
This comp search reflects your current search parameters — adjust the filters above as needed for a more accurate estimate.
Estimated Value
—
Average $/Sqft
—
Check one or more comps below to calculate an estimate.
Nearest 10 of 61 comparable sales and listings within 1 mile of this home. Use the filters above and press Search to refine.
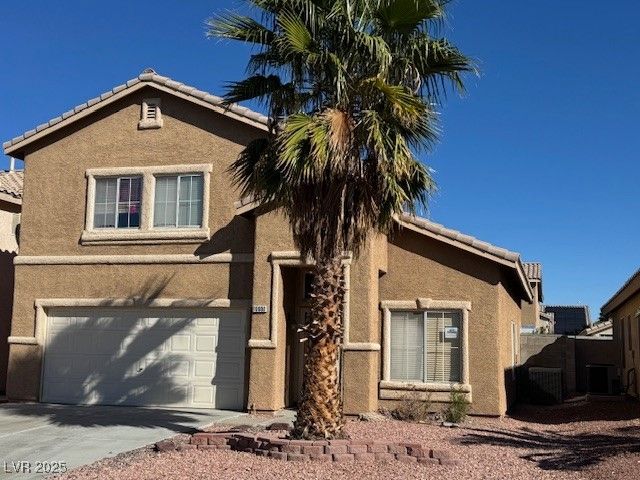
$424,5003 bd3 ba1,643 sqft$258/sqft0.05 mi33 days
$424,0003 bd3 ba1,692 sqft$251/sqft0.08 mi34 daysSold 2026-07-23
$435,0003 bd3 ba1,643 sqft$265/sqft0.09 mi5 daysSold 2026-06-23
$477,7504 bd3 ba2,169 sqft$220/sqft0.12 mi332 daysSold 2026-05-19
$400,0003 bd3 ba1,520 sqft$263/sqft0.13 mi5 daysSold 2026-07-06
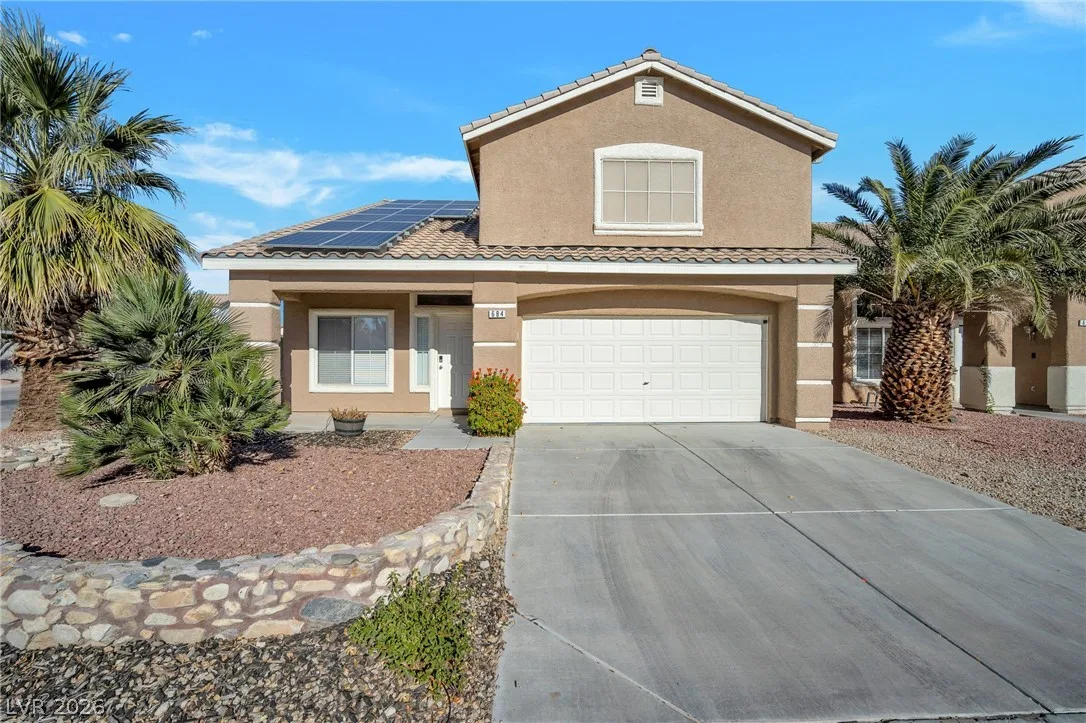
684 Gritty Garnet AvenueActive
$525,0004 bd3 ba1,881 sqft$279/sqft0.14 mi2 days
$380,0003 bd3 ba1,866 sqft$204/sqft0.15 mi21 days
$440,0002 bd3 ba1,529 sqft$288/sqft0.15 mi61 daysSold 2026-07-02
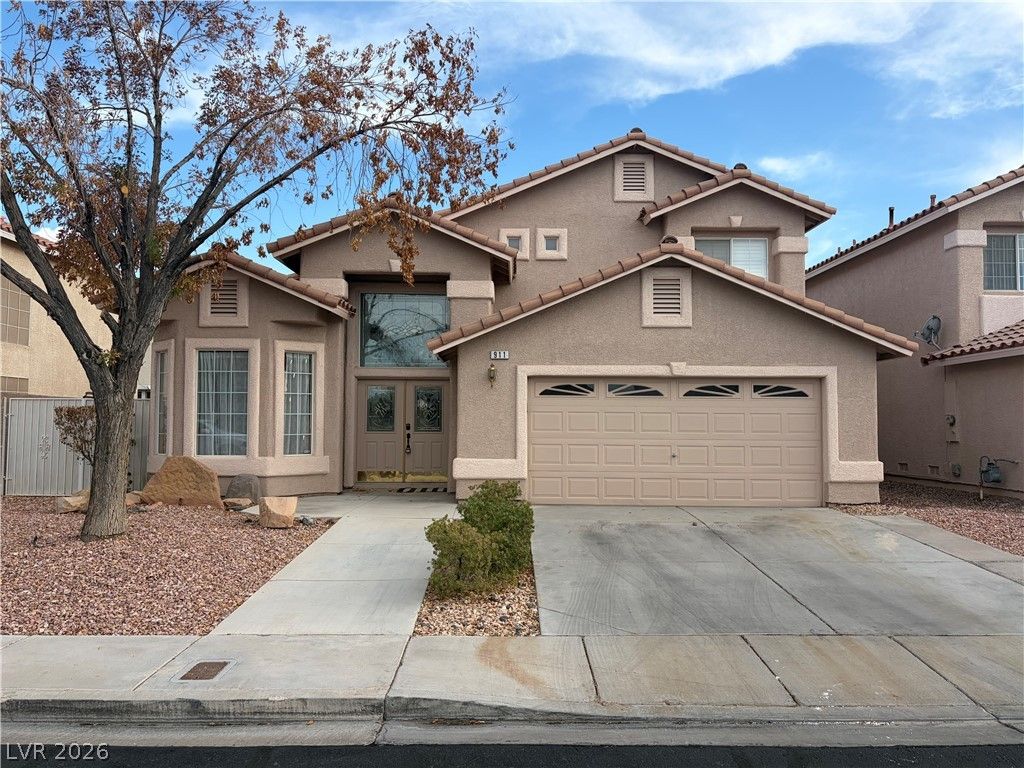
911 Sterling Thorn CourtActive
$450,0003 bd3 ba1,866 sqft$241/sqft0.16 mi40 days
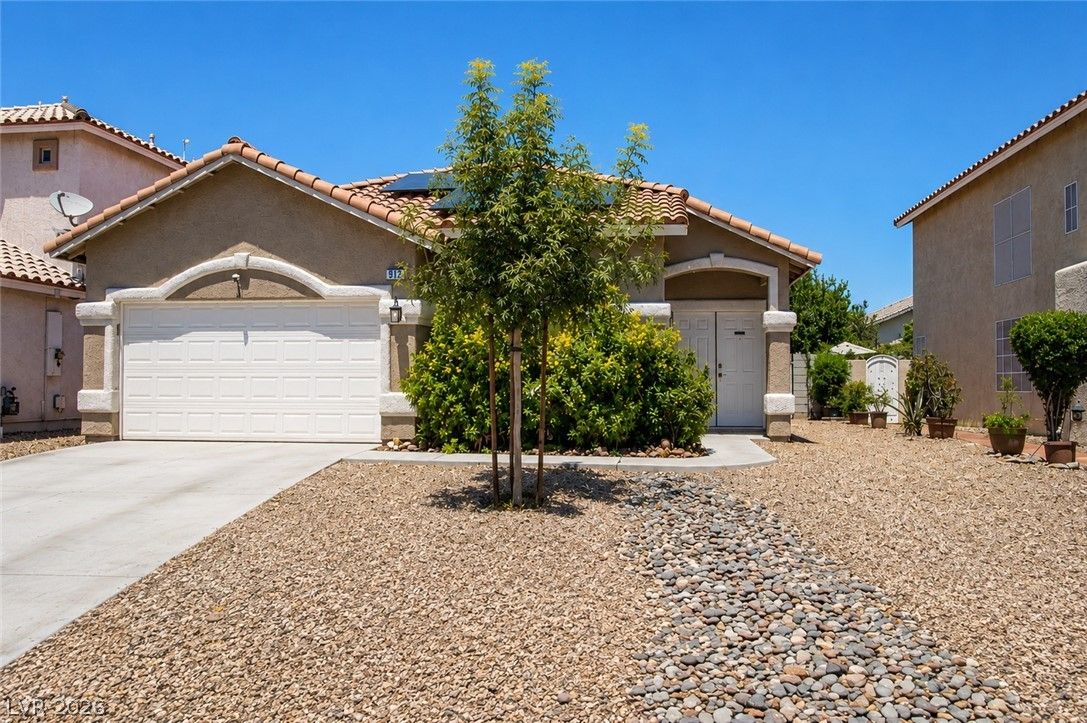
912 Sterling Thorn CourtActive
$424,9993 bd2 ba1,504 sqft$283/sqft0.16 mi78 days
Nearest comparable sales and listings
12 comparables · median price $435,000 · range $380,000 – $525,000 · median $/sq ft $254 · average $/sq ft $249
| Address | Status | Price | $/Sq Ft | Bd / Ba | Sq Ft | Sold / market time | Distance |
|---|---|---|---|---|---|---|---|
| 10000 Clear Crystal Street | Active | $424,500 | $258 | 3 / 3 | 1,643 | 33 days on market | 0.05 mi |
| 10085 Mystic Dance Street | Sold | $424,000 | $251 | 3 / 3 | 1,692 | Sold 2026-07-23 | 0.08 mi |
| 718 Peach Coral Street | Sold | $435,000 | $265 | 3 / 3 | 1,643 | Sold 2026-06-23 | 0.09 mi |
| 829 Dancing Vines Avenue | Sold | $477,750 | $220 | 4 / 3 | 2,169 | Sold 2026-05-19 | 0.12 mi |
| 794 Ribbon Grass Avenue | Sold | $400,000 | $263 | 3 / 3 | 1,520 | Sold 2026-07-06 | 0.13 mi |
| 684 Gritty Garnet Avenue | Active | $525,000 | $279 | 4 / 3 | 1,881 | 2 days on market | 0.14 mi |
| 898 South Dancing Rain Court | Active | $380,000 | $204 | 3 / 3 | 1,866 | 21 days on market | 0.15 mi |
| 723 Elliot Peak Avenue | Sold | $440,000 | $288 | 2 / 3 | 1,529 | Sold 2026-07-02 | 0.15 mi |
| 911 Sterling Thorn Court | Active | $450,000 | $241 | 3 / 3 | 1,866 | 40 days on market | 0.16 mi |
| 912 Sterling Thorn Court | Active | $424,999 | $283 | 3 / 2 | 1,504 | 78 days on market | 0.16 mi |
| 893 Dancing Vines Avenue | Sold | $435,000 | $201 | 4 / 3 | 2,169 | Sold 2026-07-09 | 0.17 mi |
| 10142 Rice Paper Street | Active | $439,950 | $235 | 4 / 3 | 1,875 | 0 days on market | 0.19 mi |


